Explore the World’s Best Weather API
Get reliable and precise weather data through our free API. Count on Tomorrow.io for quick access to up-to-date information, trusted by businesses and developers. Use our advanced interfaces to build weather-dependent features on your app or website.
Integrate and Adapt with the World’s Best Free Weather API
Get fast, reliable, and hyper-accurate weather data from our Weather API with 60+ layers and insights
Real Time
Integrate cutting-edge, real-time weather data directly into your applications.
Weather Forecast API
Historical Weather API
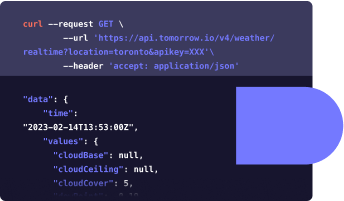
curl --request GET
--url 'https://api.tomorrow.io/v4/weather/realtime?location=toronto&apikey=XXX'
--header 'accept: application/json'
{
"data": {
"time": "2023-02-14T13:53:00Z",
"values": {
"cloudBase": null,
"cloudCeiling": null,
"cloudCover": 5,
"dewPoint": -0.19,
"freezingRainIntensity": 0,
"humidity": 100,
"precipitationProbability": 0,
"pressureSurfaceLevel": 1005.56,
"rainIntensity": 0,
"sleetIntensity": 0,
"snowIntensity": 0,
"temperature": 0.31,
"temperatureApparent": 0.31,
"uvHealthConcern": 0,
"uvIndex": 0,
"visibility": 14.43,
"weatherCode": 1000,
"windDirection": 278.31,
"windGust": 1.19,
"windSpeed": 1.19
}
},
"location": {
"lat": 43.653480529785156,
"lon": -79.3839340209961,
"name": "Old Toronto, Toronto, Golden Horseshoe, Ontario, Canada",
"type": "administrative"
}
}Leverage Tomorrow.io’s Free Weather API
Weather Forecast & Real-Time API
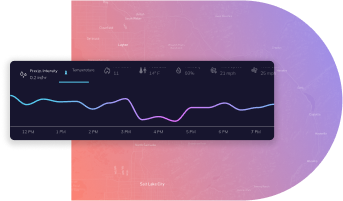
Integrate accurate and comprehensive weather data into your applications with Tomorrow.io’s free Weather Forecast API, the ultimate solution for developers and businesses. Get the most precise and reliable weather predictions for any location around the world. Enhance your applications and provide your users with valuable weather data insights with our cutting-edge technology and algorithms.
Historical Weather API
Unlock the power of historical data with our Historical Climate API. Access hourly and daily weather data from up to 20 years in the past, providing valuable historical insights for your applications. Climate Normals’ high-resolution data and innovative aggregation options make it an essential tool for anyone looking to understand and manage the impacts of climate change.
Weather Maps API
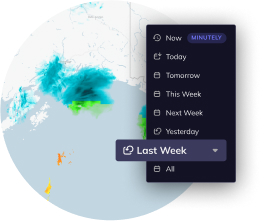
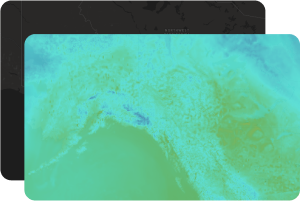
Enhance your maps with accurate weather conditions using Tomorrow.io’s Weather Maps API. Retrieve map tiles at any given moment and easily integrate them with popular interactive map libraries like Mapbox, Google Maps, and more. Improve user experience and provide valuable insights with the best weather API.
Weather Monitoring API
Access ultra-accurate, hyperlocal data up to 14 days ahead for any location on the globe for free. Get constant monitoring of predefined locations /.llop0-0–0 insights with our Weather Monitoring API. Configure conditions with a combination of parameters, operators, and constants, or select from our rich collection of templates based on your industry’s use case.
Flexible Plans Built to Scale as You Grow
Free
For individuals or teams just getting started
- 5-Day Forecast
- Weather Timelines and Trendlines
- Weather API Access
- Core Weather Data Layers
- Industry-Based Insights Templates
- 24 hours Historical Weather Data
- 1 Automatically monitored Location
- 1 Weather-Based Alert
Enterprise
For teams and companies that need to manage work across initiatives.
- 14-Day Forecast
- Custom SLAs
- Weather on routes
- Tomorrow.io Premium Data Layers: Air Quality Pollen Solar Land Lightning and more
- Technical and Meteorological Support
- SAML – based single sign-on (SSO)
- Custom Automatically Monitored Locations
- Custom Weather-Based Alerts
- Location Types: Point Polygon Polyline
- Advanced historical capabilities
- Weather Maps Solutions
- On Demand RPS
- Minutely Resolution Data
- And more..
Developer Tools
Check Out Our Community Guidelines
Learn more about how to get in touch with the team via our community guidelines.
Check Out Our Postman Collection
This quickstart will get you up and running with Postman and the Tomorrow.io weather API solutions.
Recipes
A sandbox for experimenting with our API.
Learn More About Our Weather API
Discover how our weather API can transform your projects and decisions in the face of unpredictable weather.
