Most people think of weather applications as simple reporting tools to tell them the temperature and conditions for their local area. While this is true for most individuals, businesses can leverage the power of a weather API for far more benefits to protect their assets and keep employees safe. These benefits can also help individuals and your local community to give them insights into weather patterns. Overall, a weather API has numerous benefits that help keep people safe and give them (and businesses) lead time to better prepare for severe conditions.
What Can a Weather API Do for You?
The type of weather data beneficial to your community depends on your location. Wildfire data might not be beneficial for someone in a tropical environment, but tracking floods and heavy rains would be something beneficial for people in tropical environments and flood zones. In most cases, tracking weather data and making predictions can help the community as a whole, but weather APIs also have some enterprise benefits that could be used for business purposes only.
First, let’s look at a real-world scenario that would help individuals within a community. We’ll take the recent example of severe freezes predicted to hit Texas in February 2022. Severe freezing weather was expected to affect Texas again, and weather data collected from a weather API could help pinpoint geolocations to better warn residents and businesses. Severe weather conditions were expected to affect power sources, and previous freezing weather temperatures left 4.5 million people without power in 2021. The results from not being prepared threatened lives, and freezing temperatures without power was the direct cause for 246 deaths across affected areas.
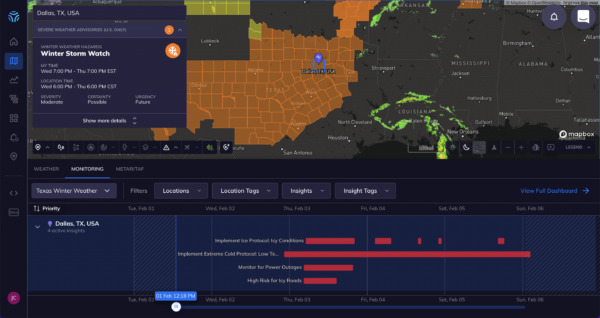
An Insight Dashboard and Map view from Tomorrow.io’s platform showing weather conditions across specific regions in Texas.
For businesses, leveraging a weather API has several benefits depending on your location, but most enterprise organizations have strategic office locations to service customers and build revenue. A weather API can track conditions at these specific office locations, but it can also help with safety of employees, improve supply chain delivery routes, or help support customers better during specific times of the day. Here are just a few examples of ways a weather API can help run your business more smoothly:
- Trucking and supply chain businesses can use a weather API to determine the best path for shipments to avoid severe weather that would cause delivery delays.
- Sports organizations can determine weather conditions at a specific sporting event to warn spectators to wear appropriate clothes and prepare stadiums for weather conditions such as rain, snow, or heat.
- Restaurants that have outside seating can determine if it should be available instead of allowing patrons to deal with unforeseen circumstances and ruin their experience.
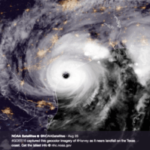
- In severe hurricane or tornado conditions, utility organizations can be prepared to respond quickly after the threat is over.
- Aviation has long used weather data to control flight paths for airline, pilot and passenger safety.
- Severe winds and rain might require businesses to board up windows or take precautions for flooding.
- For businesses with employees that commute, for their safety it would be beneficial to know when icy weather could affect roads and allow these employees to stay home and work for the day.
- Technology functionality is often disrupted by extreme heat or cold, and weather predictions can help businesses prepare for failover.
Making Simple Calls to a Weather API to Collect Weather Data
Using the Tomorrow.io API, we can show you several simple weather API calls to show what it can do for you and how to use a weather API for the first time. Let’s look at the four main Tomorrow.io API endpoints.
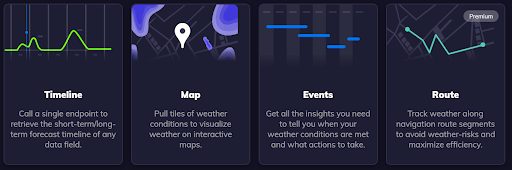
For most API programmers, the Timeline, Map, and Events endpoints are the primary endpoints for applications. The Route endpoint is available to premium customers. Here is a brief overview of each one:
- Timeline: Collect several data points to get weather conditions across a specific timeframe. For example, collect data for the entire day (24 hours) minute by minute to determine weather conditions for the given timeframe.
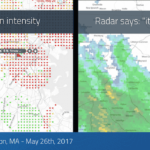
- Map: Use this endpoint to map out conditions in a visual way for your users. For example, show users a visual representation of weather conditions (e.g., rain clouds) in their hometown or place of work.
- Events: Get a list of events from your insights. Insights are a collection of weather data that meet a specific condition set in your insight configuration (e.g., get a list of times when the geographic region experiences heavy rain or wind), and events are weather conditions that could affect the community (e.g., fires, floods or hurricanes).
- Route (premium): For premium users, you can track weather conditions along navigational routes. For example, this endpoint is beneficial for shipping companies to route the best path with optimal weather conditions for truckers to take across a geographic location.
Tomorrow.io has a few other endpoints useful for your weather tracking, but the above four are the most commonly used. The Insights endpoint lets you collect data only when a specific condition is met. For example, you can get a list of times when wind speed meets hurricane categories. The Insights endpoints allow you to use several parameters to get only the timeframes and conditions that you need. We have preset insights for several weather conditions such as hurricane, fire, thunderstorms, floods, fog, tornadoes and many more. You can use pre-made insights or create a custom one that fits your interests. Insights are tied to locations, so you must set up a geolocation in your Tomorrow.io dashboard for your account.
Alerts and notifications are two more useful endpoints that tie into insights. The Insights endpoint is used to collect data based on your own input parameters, but the Alerts endpoint triggers when a specific threshold is met. You might get insights on hurricanes in the area, but you only want to trigger an alert when winds reach a specific parameter threshold. Alerts and notifications work hand-in-hand by hooking to your insights feed, triggering an alert, and then using notifications to send a message to your users.
Returning Timeline Data for a Timeframe
Let’s first take a look at the Timeline endpoint. This endpoint is beneficial for basic data collection. If you want to get data for a specific date, you must determine how much data is collected based on the time duration and time steps. For example, suppose that you want to collect weather data for the next day. You set the dates and time and input the increments, such as getting data for every hour, every minute, or every 30 minutes. This collection is the basis of your weather application that you can use to display information to your users.
Here is an example cURL call:
curl --request GET \
--url 'https://api.tomorrow.io/v4/timelines?location=607f3e4188a6a60007947b82&fields=precipitationIntensity%2CprecipitationType%2CwindSpeed%2CwindGust%2CwindDirection%2Ctemperature%2CtemperatureApparent%2CcloudCover%2CcloudBase%2CcloudCeiling%2CweatherCode&units=metric×teps=1h&apikey=YOUR_API_KEY' \
--header 'Accept: application/json'In the above GET request, we use a weather API to get data for 24 hours, but notice that the call specifies the data collected. Here is a truncated data set returned by the above call:
{
    “data”: {
      “timelines”: [
        {
          “timestep”: “1h”,
          “startTime”: “2022-02-10T22:00:00Z”,
          “endTime”: “2022-02-15T10:00:00Z”,
          “intervals”: [
            {
              “startTime”: “2022-02-10T22:00:00Z”,
              “values”: {
                “precipitationIntensity”: 0,
                “precipitationType”: 0,
                “windSpeed”: 3.19,
                “windGust”: 6.5,
                “windDirection”: 275.63,
                “temperature”: 17.13,
                “temperatureApparent”: 17.13,
                “cloudCover”: 0,
                “cloudBase”: null,
                “cloudCeiling”: null,
                “weatherCode”: 1000
              }
            },
            {
              “startTime”: “2022-02-10T23:00:00Z”,
              “values”: {
                “precipitationIntensity”: 0,
                “precipitationType”: 0,
                “windSpeed”: 2.17,
                “windGust”: 3.79,
                “windDirection”: 255.21,
                “temperature”: 14.47,
                “temperatureApparent”: 14.47,
                “cloudCover”: 0,
                “cloudBase”: null,
                “cloudCeiling”: null,
                “weatherCode”: 1000
              }
            }
          ]
        }
      ]
    }
  }
The full response has the full 24 hours, but the above JSON contains the first two sets. Data is returned in reverse order, so these two sets contain data for the last 2 hours of the day. It has several weather factors including a weather code. Weather codes give you more end-user friendly ways to display conditions, including icons. They also tell you if the condition is mixed and if it will persist throughout the day. The Tomorrow.io API has a library of weather icons that help you visually display information to your users in a friendly way.
Visually Display Weather Using Tile Output
The Map endpoint returns tile information so that you can build a map with an overlay of weather condition as a visual representation. For example, suppose that you want to get tiles that display cloud cover over a geo-specific location on a map. The map itself can be pulled from a map API such as Google Maps, and then the tiles returned from the weather API overlay cloud images over the map.
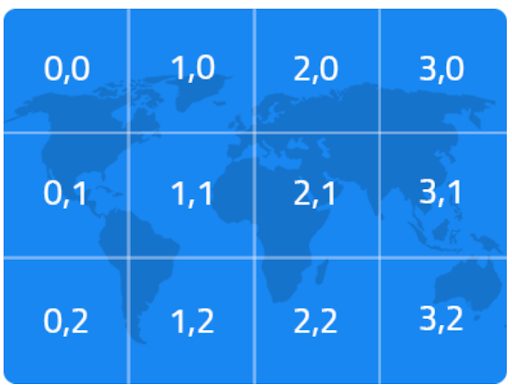
Basic map layout using tiles with minimal zoom levels
You can zoom in and out based on the detail of the map. The higher the zoom level, the more tiles you get. Tomorrow.io supports zoom levels 1-12. The more you zoom in, the more you can cover a more localized area such as your state, city, or zip code.
The following JavaScript code is a small application that pulls tiles and displays them over a Google Map:
// get your key from app.tomorrow.io/development/keys
const API_KEY = 'add your API key here';
// pick the field (like temperature, precipitationIntensity or cloudCover)
const DATA_FIELD = 'cloudCover';
// set the ISO timestamp (now for all fields, up to 6 hour out for precipitationIntensity)
const TIMESTAMP = (new Date()).toISOString();
// initialize the map
var map = L.map('map', {
minZoom: 3,
maxZoom: 10
}).setView([42.355438, -71.059914], 7);
// set the streetview
L.tileLayer('https://{s}.tile.openstreetmap.org/{z}/{x}/{y}.png', {
attribution: '© <a href="https://www.openstreetmap.org/copyright">OpenStreetMap</a> contributors'
}).addTo(map);
// inject the tile layer
L.tileLayer(`https://api.tomorrow.io/v4/map/tile/{z}/{x}/{y}/${DATA_FIELD}/${TIMESTAMP}.png?apikey=${API_KEY}`, {
attribution: '© <a href="https://www.tomorrow.io/weather-api">Powered by Tomorrow.io</a>',
}).addTo(map);The result is a cloud-covered map that displays to your users.
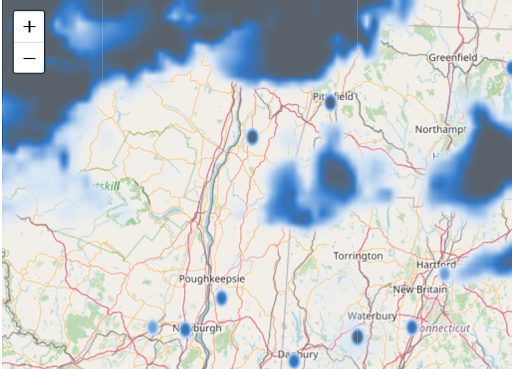
A visual representation of clouds covering a specific geographic area.
Trigger Alerts and Notifications with Event Information
Events are specific conditions that trigger from insight data. Remember that insights can be from predefined categories or your own customized insight data. For example, you might want to trigger an event when hurricane winds reach severe conditions.
As an example, the following React code monitors insight data for floods, winter conditions, temperature and wind conditions and pulls any events based on severity from this data.
import * as React from "react";
import Chart from "react-google-charts";
import axios from 'axios';

class App extends React.Component {

  static defaultProps = {
      // get your key from app.tomorrow.io/development/keys
      // ideally the request will be proxied by another server-side service, keeping the key secure
      apikey: "add your API key here",
      // pick the location, as a latlong pair array, GeoJSON geometry or predefined ID
      location: "5d6472a671330c000899876e",
      // list the insights, can also include custom insights for monitored locations
      insights: ["winter", "wind", "temperature", "floods"],
      // set the safety buffer around the location, applicable only to insight categories only
      buffer: 20
  };

  constructor(props) {
    super(props);
    this.state = { events: [] };
  };

  componentDidMount = () => {
    const props = this.props;
    const {insights, location, apikey} = props;
    // request all events matching the insights for the above-mentioned location
    axios({
      method: "post",
      // set the Events POST endpoint as the target URL
      url: `https://api.tomorrow.io/v4/events?apikey=${apikey}`,
      data: {
        location,
        insights,
      },
    })
      .then((response) => {
        console.log(response);
        this.setState({events: response.data.data.events})
      })
      .catch((error) => {
        console.log(error);
      });
  }

  // build a table of the eventValues to be shown on hover
  renderTooltip = (eventValues) => {
    return `<table style="width:50px">${Object.keys(eventValues).map((key) =>
      typeof eventValues[key] == "object"
        ? null
        : `<tr><td><strong>${key}</strong></td><td>${eventValues[key]}</td></tr>`
    ).join("")}</table>`;
  }


  render() {
    // configure unique colors, per severity level
    const colors = {
      "unknown": "#b6c0cc",
      "minor": "#ffff42",
      "moderate": "#ff7800",
      "severe": "#eb002c",
      "extreme": "#b80d0a"
    };
    let data = [
      // set the columns of the timeline chart, whereas Name is shown next to each bar and tooltip on hover
      [
        { type: "string", id: "title" },
        { type: "string", id: "Name" },
        { type: "string", role: "style" },
        { type: "string", role: "tooltip" },
        { type: "date", id: "Start" },
        { type: "date", id: "End" },
      ],
      // map all resolved events to the array structure mentioned above, in an orderly fashion
      ...this.state.events.map((event) => [
        event.eventValues.title,
        `severity: ${event.severity}   -   certainty: ${event.certainty}   -   urgency: ${event.urgency}`,
        colors[event.severity],
        this.renderTooltip(event.eventValues),
        new Date(event.startTime),
        new Date(event.endTime),
      ]),
    ];
    return (
      <div>
        {this.state.events.length > 0 && (
          <div
            style={{
              margin: "auto",
              padding: "5% 5%",
              display: "flex",
              flex: "auto",
              flexFlow: "row wrap",
            }}
          >
            <Chart
              width={"100%"}
              height={"100vh"}
              chartType="Timeline"
              loader={<div>Loading Events</div>}
              data={data}
              options={{
                tooltip: { isHtml: true },
                colors: Object.values(colors),
              }}
              rootProps={{ "data-testid": "7" }}
            />
          </div>
        )}
      </div>
    );
  }
}

export default App;
The React code creates a basic dashboard so that users can monitor these events. To see more of this application, see the Tomorrow.io Github repository to download and review the way you can use event data to monitor weather conditions.
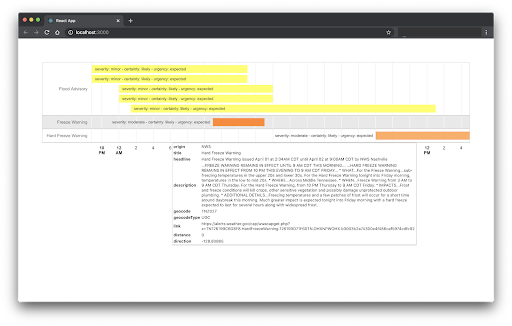
The above dashboard monitors severity and displays it in the user’s browser, but you can also use the Tomorrow.io weather API to send alerts and notifications to users. For example, alerts and notifications are useful for businesses with several locations around the world during specific catastrophes or conditions when employees might be unable to get to the office or work from home due to outages.
Conclusion
The first step to fully leveraging a weather API is to figure out how you want to use it. It could be a dashboard to help businesses stay updated on conditions to improve supply chain efficiency and employee safety, or it could be a personal project that helps you monitor weather conditions for your community.
The code snippets we shared are just a very small way the Tomorrow.io API can help you create weather monitoring applications that fit your business or personal needs. It’s easy to use, gives you accurate minute-by-minute information, and makes it easy for you to send notifications to affected individuals. It can improve your business productivity by keeping employees informed and safe, and it can improve the way your business ships and packs products and services that save money by avoiding severe conditions.