A supply chain cannot be managed in silos. A thunderstorm that affects a shipment arriving at a port will have downstream effects on at another location link on this supply chain multiple states away. Truck drivers and operators navigating complex routes across the country need to know how weather will impact every leg across the polyline of their journey. Supply chain managers need a holistic view of the weather that encompasses all their key locations and assets. That productivity – and predictability – is critical in any supply chain system to meet demand expectations and deadlines.
When having to monitor multiple locations or just one leg of a much longer journey, it can be easy to miss out on weather data and information for a specific location that then directly impacts one key link of the overall supply chain. A supply chain is only as strong as its weakest link.
To help supply chain operators manage the challenge of monitoring multiple locations at once, we have enhanced the Tomorrow.io platform dashboard to streamline the process of locational weather monitoring. For industries like supply chain and logistics, dealing with the management of multiple locations all at once, our platform now allows a spatial representation of the weather-related impacts for each pinned location, all viewable on the interactive radar map. This allows operational managers to observe the weather related status of each monitored location without having to flip back and forth between the map and the insights dashboard. Even better, users can see the differing weather impacts across a long polyline, not just from a point location.
While the insights dashboard still provides managers a forecasted drill down view of operations days in advance, this “Monitors on the Map” enhancement allows users the ability to see how weather is currently impacting the routes and job sites of interest in real-time. Instead of working with the insights dashboard like a project management tool or Gantt chart, the new view creates a more interactive and holistic experience for supply chain managers. The real-time, contextualized nature makes it much easier for business managers and operators to keep track of multiple sites and routes simultaneously.
Monitors on the Map meshes custom insights with the color-coordinated location polygons and polylines displayed on the map, providing users with a seamless, intuitive understanding of where the problem really is. This enhancement to our platform provides a more visual representation of how custom weather insights are occurring across the map, enabling the ability to quickly glance at the map view and have all the insights needed in one place.
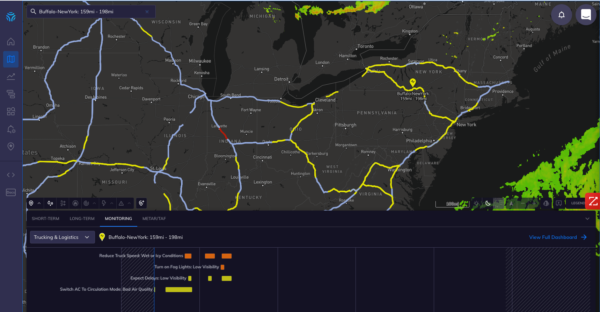
For a truck driver about to embark on a Buffalo to New York route, a quick glance at the weather insights across his polylines suggests there will be a couple of legs on the route with wet or icy conditions, as well as low visibility. There’s also a stretch with bad air quality, so the driver should switch their AC to circulation mode during this stretch.
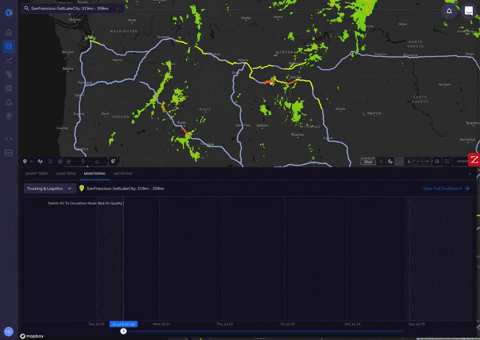
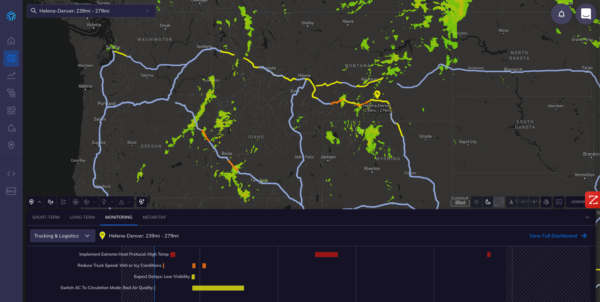
Here’s another visual example of a supply chain route going from Helena to Denver. The early part of the journey seems relatively quiet but in one of the middle legs there’s a forecast for extreme heat. Drivers will want to make sure they’re well hydrated and rested, with functioning AC, before this grueling stretch.
Being able to observe and evaluate an entire network of supply chain operations makes managing the disruption of inclement weather impacts that much easier. Rather than tracking the individual weather parameters of each site location, this all-in-one monitoring feature combines the two major silos of the Tomorrow.io interface. The active radar map is now equipped with the ability to create a visual understanding for the user of where and how weather is impacting each specific site. Seeing that the shipment arriving in one location will be delayed by thunderstorms and quickly understanding how that affects the truck delivery at a location multiple links down the supply chain is critical.
Weather information is nothing without understanding how to act on it, and with the ability to visualize weather insights on an interactive map for both point locations and polys, managing your entire supply chain network just got a whole lot simpler and more powerful.