The Brief History of Archived Weather Data
To fully appreciate the incredible value of a historical weather archive, we must first discuss the origins of weather data archiving. So, let’s take a journey back in time.
Although weather events have been taking place for millennia, the notion of systematically recording these events is relatively recent, with significant interest only starting around the last two hundred years.
According to the National Weather Service, weather networks began to grow and expand in the mid-1800s, even though meteorological instruments had existed for over 100 years. With the invention of the telegraph in the 1900s, weather observations from distant points could be rapidly collected, plotted, and analyzed at one location.
In our present day, we collect weather data through:
- The launch of 900 weather balloons worldwide every 12 hours, including 92 in the United States and its territories.
- Thousands of commercial planes and ships in transit continually gathering weather data as they move.
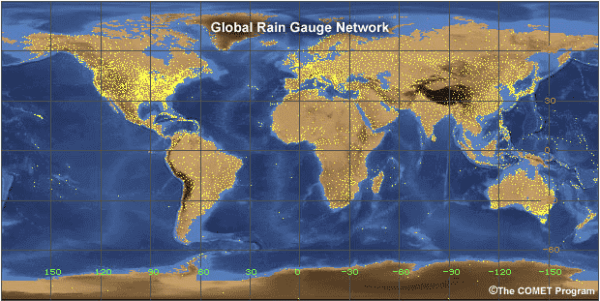
- Automated surface weather observation stations strategically placed in airports and atop ocean buoys.
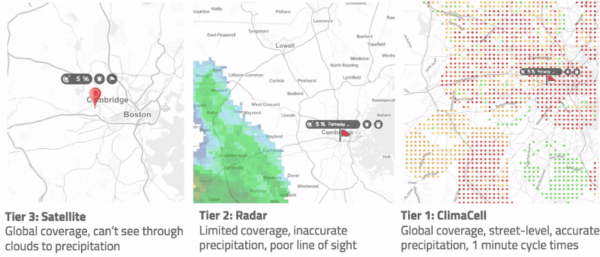
- Millions of satellite pixels and radar scans collecting multiple weather parameters every few minutes, or in some cases, every few seconds, including Tomorrow.io’s Pathfinder Satellites.
Given the vast number of weather data sources, one might question how to merge inputs from so many diverse and unique instruments effectively.
How do we manage such massive amounts of incoming weather data?
Where does all this detailed atmospheric information ultimately reside? We can better understand this by learning how virtual archives came to be.
When Did Virtual Weather Archives Come to Be?
In the early days of weather data archiving, forecasting required meticulous efforts to operate each weather observation post and generate records—manually in many cases.
As mentioned, Weather data archiving dates back to the early 1800s when scientists and meteorologists realized the importance of collecting and storing weather data. In 1869, the telegraph service in Cincinnati, Ohio, began collecting weather data and producing weather charts, creating the first systematic effort to archive weather data in the United States.
The conventional method was to store these physical records within the National Weather Bureau facilities. This approach was extremely time-consuming, and meteorologists often considered the data output not to match the effort invested. However, new technologies, such as the telegraph, radio, remote cellular communications, and ultimately the internet, rapidly advanced meteorological observation and storage, improving weather forecasting.
The idea of virtual archives for historical weather data was born, offering an easier and more accessible way to record and access this valuable information.

Navigating the Current Landscape of Historical Weather Data: Limitations and Reanalyses
Today, accessing historical weather data has become relatively straightforward.
You can directly visit government web servers such as the United States’s National Centers for Environmental Information. In this central hub, a large portion of public weather data has been funneled since the inception of dedicated weather record-keeping.
However, as you seek out weather data, you may only have access to the most recent years of a selected weather dataset. Historical weather data has limitations; this is partly due to the occasional lapse in the federal budget for critical observations and weather-related incidents that disrupt meteorological instrument systems.
In some instances, getting a comprehensive selection of historical weather data for the entire period of record can only be achieved through a special order. This process can take weeks, as data is retrieved from static memory offline, collated, and delivered to your mailbox. There can be a line of numerous other users with similar requests, making the wait even longer. Luckily, solutions have made their way forward, and we are now leveraging technology to assist weather data retrieval.
What is Reanalysis in Weather Data Handling?
Over the years, meteorologists and computer scientists have collaborated to develop methodologies to collect, aggregate, assimilate, attribute, and deliver high-quality historical weather data to the end user. This collaborative spirit is particularly evident in the private weather sector.
The most innovative companies are continually perfecting sophisticated atmospheric data algorithms that ingest various weather inputs, merge them with a background “best guess” climatology, and produce a smoothed, continuous representation of the multi-dimensional atmosphere.
This process involves parsing the atmosphere horizontally, vertically, and temporally for a unique method known as “reanalysis,” only the most potent computing systems can routinely carry it out on a global scale.
Periodically, the reanalysis is updated as scientists develop newer, faster, and more physically consistent numerical model systems for weather analysis. By running the entire history of weather observations through each new revision of weather analysis frameworks, any significant fluctuations in the data likely represent actual patterns rather than artifacts from changing analysis approaches.
The outcome of these strategic technical collaborations is the creation of vast historical weather archive repositories, continually populated with an ever-increasing store of atmospheric observations. This outcome makes the task of accessing archived weather data more manageable and efficient than ever before.
But where do you find the best historical weather data repository to use?
Better Historical Weather Data
You can find a wealth of information within historical weather data, whether derived from direct observations or reanalysis models. This data spans numerous parameters, each potentially featuring its unique physical sampling method, conventional units for reporting, and specific delivery times.
We want to reiterate that a weather reanalysis model commonly ingests observations, generates regular output, and archives the data.
To offer a glimpse into what you might find in a typical historical weather archive, we’ve provided Table 1 below. This table showcases the types of information readily accessible from a standard weather data archive.
Table 1. Example parameters, archive codes, and their descriptions from a basic weather data store.
| Parameter | Code | Description |
| Eastward Wind at 10 m | U10 | Wind component in the east-west direction near the surface |
| Northward Wind at 10 m | V10 | Wind component in the north-south direction near the surface |
| Instantaneous Wind Gust at 10 m | FG10 | Momentary wind gust speed near the surface |
| Temperature at 2 m | T2m | The temperature of the air near the surface |
| Relative Humidity | RH | The fraction of water vapor that the air can hold at a given temperature |
| Surface Pressure | Psfc | Pressure at the local elevation |
| Mean Sea Level Pressure | Pmsl | Pressure at the approximate sea level if the local elevation is greater than 0 meters |
| Accumulated Precipitation | Ptot | The total precipitation that falls within a given time interval |
Leveraging Derived Weather Data for Decision-Making
Tapping into the wealth of “historical weather data” can sometimes reveal more than meets the eye. Reanalysis models, which amalgamate data from surface, upper-air, satellite, and radar observations to produce regular outputs of core meteorological variables, often offer additional invaluable insights. These models can generate a plethora of diagnostic data that, when thoroughly examined by a skilled atmospheric scientist versed in analyzing multiple weather parameters simultaneously, can unlock a veritable treasure trove of potential insights. This goldmine of historical weather data helps meteorologists leverage value-added metrics to provide vital decision-making criteria for clients seeking the best weather data.
For instance, we can glean the most likely height of the base of clouds from near-surface temperature and moisture. Cloud base height can also communicate information about low-level visibility. Vertical wind shear over different altitude intervals can be determined using winds, pressure, and temperature characteristics across multiple levels of the atmosphere, which is crucial in hindsight for airlines looking to schedule service at a given airport throughout the different months of the year. Pair temperature output with the amount of liquid precipitation, and you can now understand the depth of frozen precipitation–which can guide snow removal operations or inform future orders of road treatment products.
These extras are “derived” quantities obtained from proprietary post-processing techniques, some of which we briefly outlined in Table 2 below.
Table 2. Example parameters, archive codes, and their descriptions from a derived weather data store.
| Parameter | Code | Description |
| Cloud-top Height | CTH | The maximum elevation of the top of storm clouds |
| High Cloud Fraction | HCAP | The percentage of area covered by cloud at high altitude |
| Low Cloud Fraction | LCAP | The percentage of area covered by cloud at low altitude |
| Average Vertical Velocity | W | The approximate speed of upward and downward motions |
| Precipitation Type | Ptype | The indicator for determining the type of precipitation (Rain, Ice Pellets, Snow) |
| Snow Accumulation | Snow | The total frozen precipitation that falls in a given time interval |
| Downwelling Solar Flux | DSF | The amount of solar radiation reaching the surface |
Ensuring Quality Control and Correct Interpretation of Weather Data
Historical weather data, in its most authentic form, is a web of complex information that often requires significant quality control before analysts can effectively decipher and interpret the stats and information.
Prior to interpreting weather data or drawing any conclusions, this step is crucial for accurate understanding.
A significant factor in this process is correctly interpreting and analyzing weather parameter units.
Raw data, for example, may present wind speed in meters per second, a standard format for scientific research, whereas general users might expect to see this in miles per hour. Overlooking such a distinction can lead to discrepancies, in this case, by a potential factor of two when converting, the implications of which can impact decision-making processes in industries like construction, where wind speed data could influence the use of heavy machinery.
The archive data characterizing a particular location may also be a composite of observations from surrounding areas. This characterizing occurs when no precise weather observations are available at the original reference point. These archives produce results by adjusting or ‘weighting’ these combined observations, considering their spatial and temporal relevance.
Premium archive products enhance this data by including confidence metrics. These metrics express the likelihood of the true data value falling within a certain range, such as a 95% chance that the real data value lies between X and Y.
Furthermore, each data product or collection of products typically includes an identifier that links to metadata. Metadata comprises a set of tags and attributes providing additional information about the data. This metadata makes it crucial to verify the accuracy of data values.
For example, make sure a value of ‘1’ in the data is indeed ‘1’ and not a representation of a different unit like 1.0 times 103 kg m-3. Extracting and understanding the information from metadata allows for any necessary data conversions.
Utilizing Downscaling Methods for Micro-Scale Weather Intelligence
So far, we’ve discussed the core facets of weather data, but we’ve yet to explore how downscaling methods enhance the production of top-tier historical weather archive products. Despite the limitations that prevent scientists from observing the atmosphere everywhere and at every moment, the rising demand for micro-scale weather intelligence in commercial and industrial sectors hasn’t gone unnoticed.
Companies like Tomorrow.io are leading the way in this sphere, pioneering innovative techniques to deliver precise weather data for areas as small as individual farm plots or varying slopes of a ski resort. By integrating physical reasoning with validated statistical methods, Tomorrow.io has successfully enhanced data granularity.
In essence, these downscaling techniques are a means to translate coarsely spaced data from global weather models and sparse observations into fine-mesh details pinpointed every couple of miles over almost the entire surface of Earth. This breakthrough in data science has empowered Tomorrow.io to revolutionize how clients engage with historical weather data archives, ensuring they receive the best weather data available.
Access to Historical Weather Data
OUT with static database granules and IN with scalable, flexible archive data objects in the commercial data cloud.
That’s where Tomorrow.io makes a difference with historical weather data.
Traditionally, the massive weather collections that are the subject of the discussion thus far have been hosted within a number of separate, digital silos on the internet. In actuality, this might imply that many clients attempt to access a given data subset through a single-host server bastion.
Read: bottleneck.
The current process is lengthy, convoluted, and complex, with users needing to log into a data portal, copy files to a directory, build software to unpack that data, apply required transformations to display information, and then finally port that data to a downstream application on a given network infrastructure.
Thanks to Tomorrow.io’s innovative cloud-based weather data archiving methodology, harnessing the full potential of historical data is easy.
This approach allows numerous clients to access all data within its cloud repository simultaneously, greatly improving efficiency and reducing system memory overhead. Tomorrow.io’s new-normal weather data archiving methodology allows multiple remote clients to reference the same instance of all data existing within its cloud repository at once.
Imagine a harbor filled with ships. Traditionally, each ship would enter one by one through a single channel. But what if all ships could dock simultaneously along the shoreline? That’s the essence of Tomorrow.io’s cloud-based data archive system.
By parallelizing the input-output process, this method significantly cuts the time-to-delivery, allowing clients to access archived weather data within seconds or minutes rather than waiting for hours or days using traditional methods.
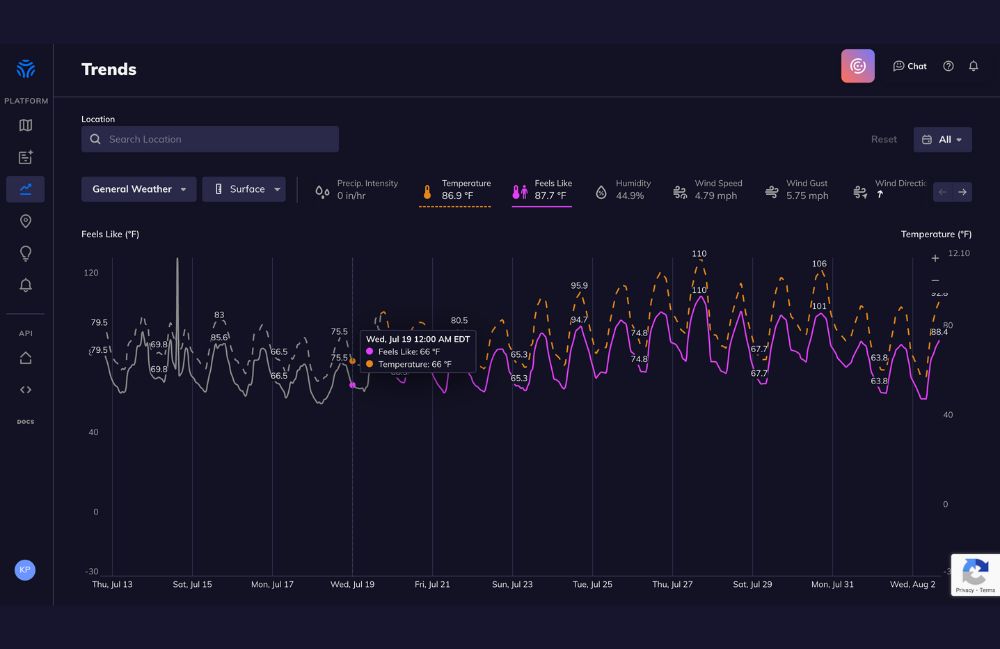
The power of the modern cloud-computing paradigm is seamlessly integrated into the Tomorrow.io weather intelligence platform, making historical weather data more accessible than ever. With an intuitive web interface embedded within the platform, users can easily request historical data parameters for any combination of locations and times from the archive. A comprehensive catalog, akin to a virtual “yellow pages” directory, succinctly summarizes Tomorrow.io’s extensive collection of weather information spanning multiple decades.
The platform’s backend swiftly consolidates data chunks from the archive, even for basic queries on daily weather conditions, delivering the requested information in milliseconds. Tomorrow.io can also accommodate more complex inquiries that require specific geographic limits or gridded data partitions over multiple years with speed and precision. These data chunks are available in several ways to suit the user’s choice, like via Weblink or batch download option. This optimization allows users to spend less time collecting data and more time taking decisive action based on data insights.
Many global businesses leverage Tomorrow.io’s historical weather data to propel their enterprises forward. Each day, the platform appends terabytes of new data to its stores without needing clients to update configurations. As this rich dataset flows through Tomorrow.io’s rigorous quality control processes, it becomes immediately available to inform new iterations of machine learning models and power downstream applications.
And thanks to this uninterrupted connection to Tomorrow.io’s robust historical weather data archive, operational, logistical, and performance models are consistently enhanced, becoming smarter overnight. Embracing the future of weather data with Tomorrow.io – the most comprehensive and efficient weather data archive available today—can be easily done.
Why Choose the Tomorrow.io Historical Weather Archive?
With the best weather archive available, Tomorrow.io’s historical weather data allows people, businesses, and governments to unleash the power of past weather data sets on their organization’s needs and boost performance.
Since its inception, Tomorrow.io has been committed to providing its clients with access to years and decades of weather data.
Our historical weather database is meticulously fine-tuned for every location around the world, ensuring no matter where your business assets or key facilities are, Tomorrow.io has you covered with a variety of historical weather data through:
- Using the recent history weather API, you can access historical weather data for your location, including minute-by-minute, hourly, and daily data for the last 7 days.
- Tomorrow.io’s Historical Weather API allows you to query weather conditions by specifying the location, fields, time stamps, and the start and end to include a historical timeline up to 20 years in the past.
- Climate Normals is a comprehensive view of climate patterns over a 20-year period. Using weather data with an hourly temporal resolution, the Climate Normals calculates and presents data between 2000 and 2020.
With the power of historical weather data sets, you can make a greater business or organizational impact.
- Empower your business with access to custom data sets; with Tomorrow.io, you can access a month’s worth of data with a single API call by specific location, field, and time frame up to 20 years in the past.
- Prepare yourself for any project confidently; Tomorrow.io’s data is verified and trusted by a diverse pool of experts, including data scientists, meteorologists, and leading enterprise businesses.
- Historical data meets your needs; Tomorrow.io allows you to conduct trend analysis, validate historical events, and enhance decision-making by supporting your future forecasts.
- Combine historical data with hyperlocal forecasts; Tomorrow.io’s weather intelligence platform provides actionable insights by blending historical and hyperlocal data.
- Fast-track your success; With ready-to-go recipes and use cases, you can accelerate using historical weather data in your systems.
Tomorrow.io Subscription Tiers
Tier-3: Basic Access
Affords the client to access most weather parameters from single stations and for selected years
Tier-2: Complete Access
Unlocks archive data stores featuring basic gridded meteorological data with resolutions as high as approximately 30 km globally, every hour.
Tier-1: Unlimited Access
Subscribers gain unlimited access to Tomorrow.io’s flagship, proprietary observation and modeling archive data, which includes hyperlocal regional and 5-km global data with timesteps as short as 15 minutes.
The beauty of Tomorrow.io’s cloud-based historical weather archive is that users can opt to take as much or as little data as needed–all on demand.
Conclusion
As we learn about the importance of historical weather data, the history of weather data archiving, it’s clear that we’ve come a long way with technological advancements and new data sources.
Tomororw.io sits at the forefront of this innovation by providing historical data through an API and through a weather and climate resilience platform that provides insights and alerts for daily weather.
Tomorrow.io is not just a data provider, but a critical partner in navigating the complexities of historical weather data. Our commitment to providing the most accurate, comprehensive, and user-friendly weather data archives, coupled with our innovative cloud-based solutions, enables us to help clients make well-informed decisions and drive their enterprises forward.
With the insights gained from our historical weather data, our clients can chart a course toward a future that is well-prepared for whatever the weather brings.