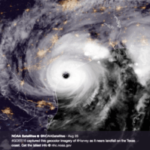
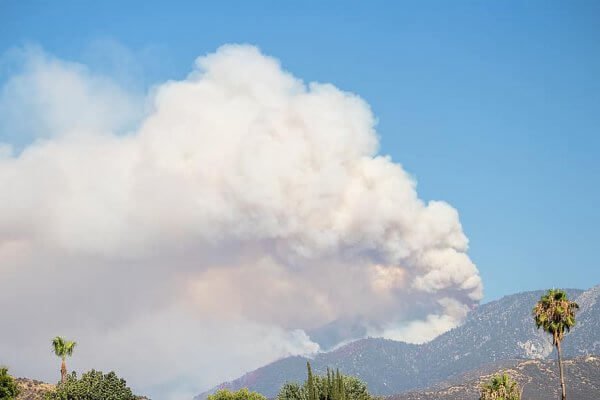
In mid-August, an extreme heat wave and an uncommonly active bout of lightning storms sparked numerous wildfires in California and Colorado. More than 1.25 million acres of land have already burned, and throughout the fires, much of the Western and Central US have been covered in a plume of smoke.
In fact, smoke from the wildfires in California is visible as far away as Kansas. It’s no surprise that the smoke has caused air quality to reach dangerous levels that are unsafe to breathe.
To better understand whether or not it’s safe to go outside, many people have turned to air quality index (AQI) forecasts. Because of the elevated particulate matter (PM) levels, many people can’t go running outside, go for a walk, or even open their windows safely. And that challenge is even greater for those suffering from specific health problems like COPD or asthma. AQI is a simple way to communicate the potential impact of air pollution, which can be affected by many different factors.
However, different platforms sometimes report different AQIs because of the various air quality measurements and air pollution modelling used in their algorithms. So how do you understand the difference of AQIs reported by different platforms and how to know when it’s safe to go outside?
Here’s what you need to know about air quality.
Gaps in governmental air quality data
Air quality data varies greatly depending on where you live.
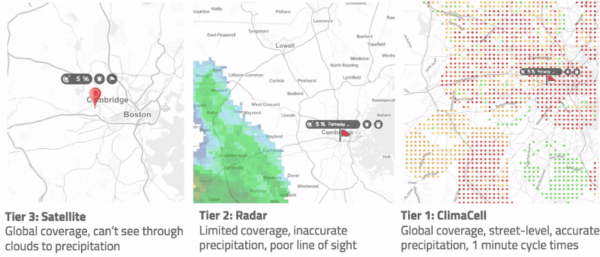
The city of San Francisco, for example, has only one EPA air quality observation site to cover an area of 46 miles. The complex surface structure due to tall buildings, local traffic at different levels, and other factors lead to spatial variance of air pollution in megacities — air quality can quite literally change on a street-by-street level.
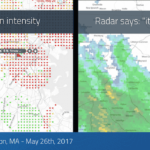
The EPA AirNow map is an example of a public-facing product which communicates these types of observations. But despite the potential variance of air quality across the region, the EPA AirNow map would show only one uniform air pollution level for the entire city — no matter where you are located.
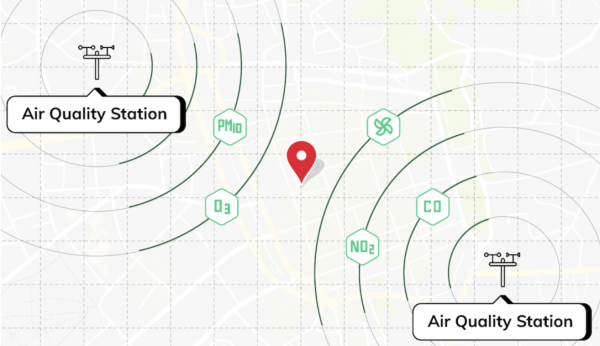
If you’re in-between several distant air quality observation stations, though, it’s not always clear what the air quality is truly like where you stand.
The air quality can vary dramatically at the street-level — especially in a city like San Francisco. If there is smoke blowing from northeast into the city and you can see a gradual diffusion of the smoke from east to west. There are also many local pollution sources from automobiles and other industries that can cause the air quality to differ across the city.
Unfortunately, not all air quality analyses take this level of detail and information into consideration.
How the Tomorrow.io Air Quality Index works
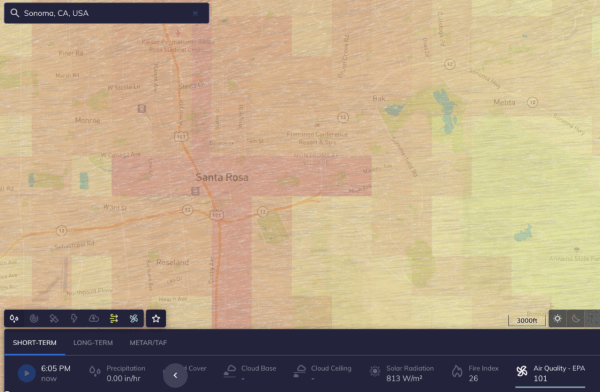
This is exactly why hyperlocal air quality is so useful. At Tomorrow.io, we analyze the air quality at 1 kilometer resolution. For example, Tomorrow.io offers around 200 air quality data points across the entire San Francisco city — compared to just one uniform value shown on EPA AirNow platform.
Download the Tomorrow.io App Now
Our real-time data analysis highlights how the pollutants are distributed across an area based on a number of parameters including:
- Air quality and atmospheric chemistry model forecasts
- Road network
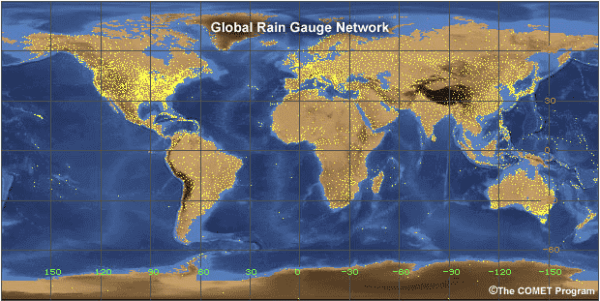
- Satellite and ground-based air pollutant observations
This means that our solution can show more granular and location-sensitive results — such as for your specific neighborhood. We often analyze a huge difference in air quality across the San Francisco region and in many cases we’ve confirmed this huge spatial gradient by validation against dense, hyperlocal observations from a third party. This illustrates the robust power of our solution.
What this means for your business
Air quality is sensitive to your specific location and Tomorrow.io’s proprietary algorithm helps you resolve this spatial difference. Sometimes the pollution may be worse, and sometimes better. But no matter what, you’ll know whether it’s safe to be outside.