Let’s start with a story. A true story.
Just a few months ago, a team from Tomorrow.io sat in a room with a few operational folks from a major railway to better understand how their operations worked — a learning session of sorts.
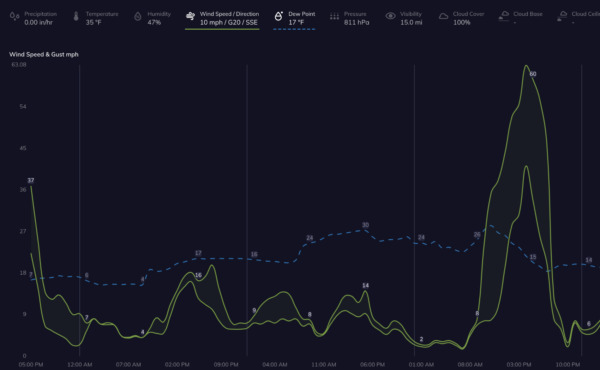
It seemed like a normal morning as the railway team worked to finalize departure schedules for the coming days before our session began…and that’s when our team spotted something. An unexpected high wind storm was coming in three days and would hit one of their trains on route, derailing cars and causing hundreds of thousands in damages.
The team froze.
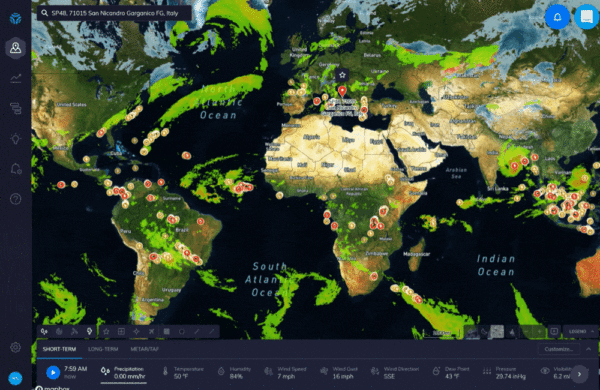
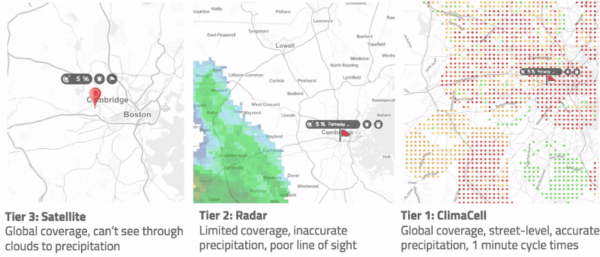
They looked at us, asked us if we were sure about the impact. We said we were, and quickly visualized the incoming wind and the hyperlocal locations that would be impacted:
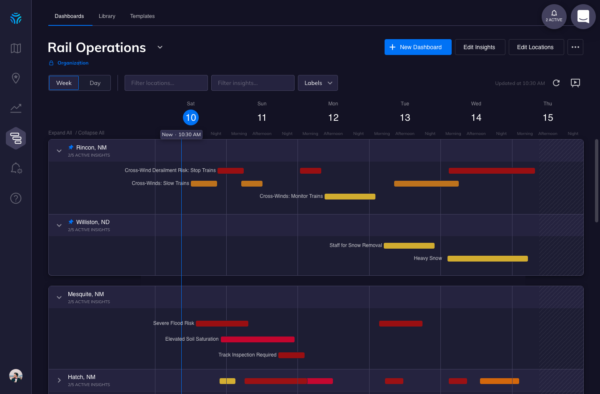
The team worked quickly to reschedule and re-route their train. Sure enough, the major wind storm hit, but thankfully at the time of the storm there were no trains on the track to be damaged or derailed.
Crisis averted.
The team was able to see incoming winds of 50+ MPH 3 days out and the impact that wind would have down to the rail-level of hyperlocal targeting, and that made all the difference.
Touted as the world’s most productive, safest, and lowest cost freight system, the railroad industry is massive with a $75B market cap in the U.S. alone. Given the current and future impact of COVID-19, the railroad industry is also rapidly becoming an even more essential pillar of our GDP and functioning economy. But there’s a problem. The industry suffers from hundreds of millions in weather related damages every year, and it’s an issue all 7 of the Class I railroads and 600 short-line and regional railroads suffer from throughout the 140,000 rail mile system across the United States.
Hundreds of Millions Lost by Railroad Operators
Let’s start with the big one. The average cost of a derailment is $10,000,000.
A study done by the Volpe National Transportation System identified additional major categories of weather related damages and the average cost per incident, which include:
- Collision: $150,285
- Obstruction: $77,971
- Fire/Violent Eruption: $35,000
- Other: $80,797
In addition to these costs, the average number of injuries/deaths per incident include:
- 2 injuries or deaths for each derailment incident
- 1 injury or deaths for each collision/other incident
- 0.5 injury or deaths for each obstruction incident
While these are scary numbers, what’s more concerning is the rate at which annual train financial damages can increase if not managed properly. For instance, a study done by Princeton showed how annual train financial damages increased 38% over the course of just a 9 year period.
Types of Weather Events Causing Damage
While there are a number of weather elements impacting railroad operations, they can be categorized as follows along with the percentage of total incidents each cause:
- Temperature extremes (heat, cold, variation) represent 26.1% of railroad weather incidents
- Liquid precipitation: 23.1%
- Wind velocity: 20.9%
- Frozen precipitation: 18.5%
- Fog: 2.6%
- Other: 2.1%
- Frozen load: 1.2%
- Slide (snow, mud, rock): 5.0%
- Lightning: 0.5%
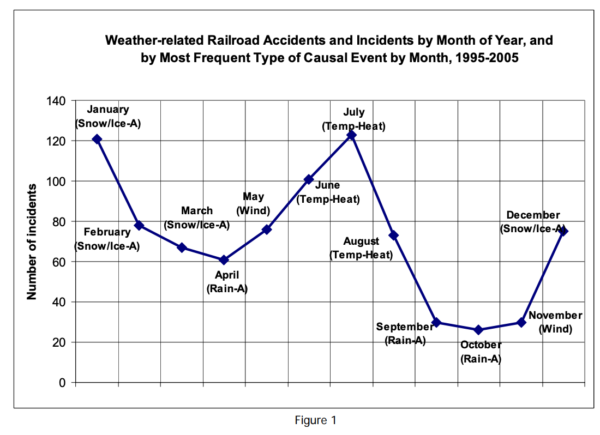
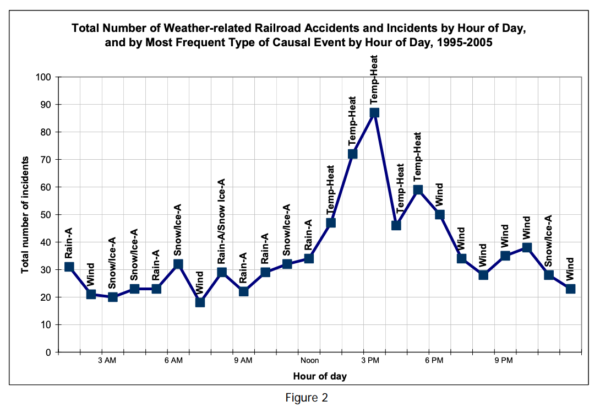
Given seasonality, Volpe’s report goes on to highlight which months on average represent the greatest weather risk (which naturally will vary by location), as well as the time of day when each event occurred.
While there are some obvious takeaways from these charts such as snow risk in January and heat risk in July, the data is less actionable at the hyperlocal level. Additionally, the aggregation of the seasonality data along with the time of day data is where things start to become more valuable with additional data sources. For instance, note the morning brings the highest risk of precipitation, middle of the day is susceptible to temperature variability, and later in the day sees the highest percent of wind related accidents.
Applying Weather to Best Practice Rail Operations
The types of decisions weather elements necessitate for railroad operational teams while vast, can be managed when bucketed into a few different categories, which Volpe’s study goes on to document. Essentially, the three main Clarus attributes consist of sky, track, and hydro. (CBRN is an additional hazard but not one we’ll cover in this report.) Let’s highlight a few of the types of decisions each of these core attributes impact and how to minimize risk.
Attribute 1: Skies
Elements: This includes temperature variability, wind, tornadoes, precipitation, visibility, and air quality
Insights and decisions:
- Understand crosswinds to move and shift weight or stop train
- Usage of high profile railcars and double-stacked container trains
- Go/no-go departure/arrival decisions
- Scheduling and delivery
- Staff safety
- Cargo risk
- Delays and stoppage
- Visibility risk from fog or structural risk from wind gusts
- Operational improvements, procedures and protocols
Attribute 2: Track
Elements: Track condition from wetness, temperature, ice, snow, water, surface temperature and moisture
Insights and decisions:
- Trip time ETAs
- Staffing and scheduling
- Contingency plans
- Dispatch, routing, and re-routing in real time
Attribute 3: Hydro
Elements: Risk from nearby rivers, streams, lakes, coast including soil saturation, water levels, flow rate, flood stage, wave height
Insights and decisions:
- Soil saturation impacting rails and needing to schedule rail inspection
- Routing and rerouting in real time
- Optimizing connections for intermodal transfers
- Strategizing railcar placement and staging equipment
As you can see, each specific type of weather event has a real impact on railroad operations. For operators, trying to predict and understand which weather events will happen, when, where, and what the impact will be is a 24/7 job. These are just some of the reasons the railroad industry has been operating with such a heightened level of risk exposure for decades, because there hasn’t been a way to automate risk impact across all trains and rails during every second of every day. Until now.
How Predictive Weather Intelligence Improves Efficiency, Saves Millions, and Maximizes Revenue
Here’s the great news: all of these impossible-to-predict weather elements, operational nightmares, and deep financial implications of the weather on your railways for years can magically go away.
How? With Tomorrow.io’s predictive weather intelligence platform and insights dashboards. Our proprietary “weather of things” intelligence engine aggregates hundreds of millions of weather data points to give you the most actionable operational guidance across your hundreds, thousands, or tens of thousands of hyperlocal locations.
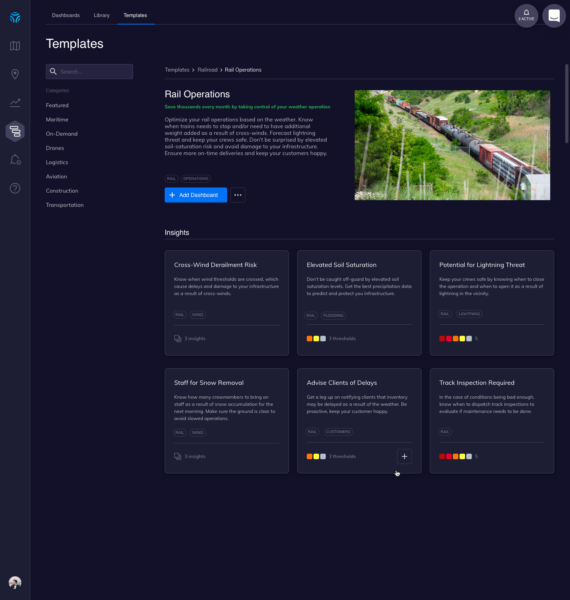
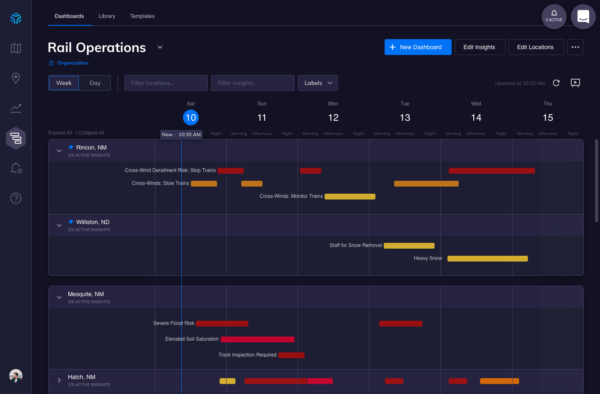
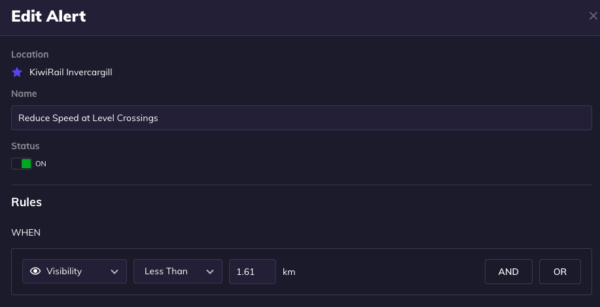
First: Our Insights Dashboard tracks all of your rails, trains, and schedules days in advance, and alerts you when any are at risk of weather. You can manage and optimize to custom weather impact use cases or use our prebuilt templates we’ve developed from our experience within the railroad industry.
Second: We do more than tell you the forecast, because having the forecast isn’t actually helpful. Tomorrow.io tells you what the impact of upcoming weather will be on your operations and what you should do, taking into account historical, real-time, and forecasted data for all of your locations. In addition your team will know the exact steps to proactively take to both mitigate the impact of operational, financial, and safety risks, while also being able to take advantage of new opportunities to unlock new revenue streams.
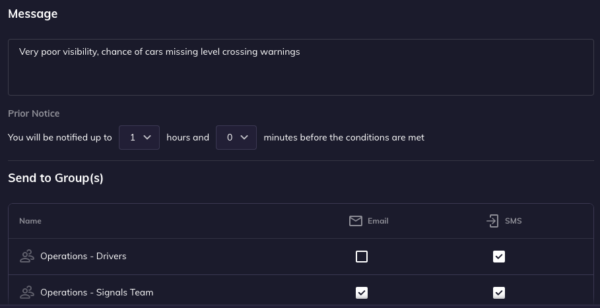
Third: Teams can automate employee communications and protocols to ensure one source of truth with automated messaging and alerts.
So what are you waiting for? Talk to one of our railway weather experts today. We’ll first look to understand your current processes and pain points, and from there help you map the best solution for your specific organization, rail lines, and team needs.
See How Tomorrow.io Can Help
