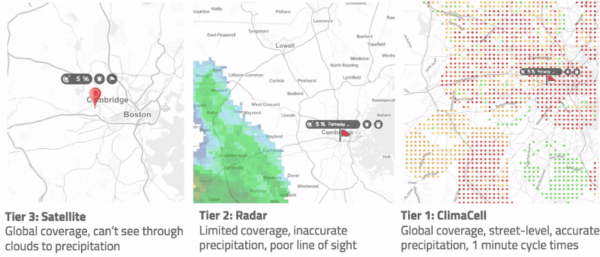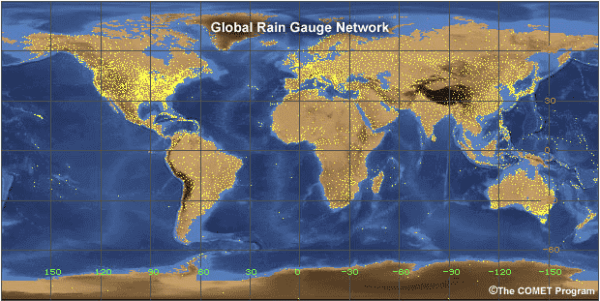
An Overview of Global Precipitation Data
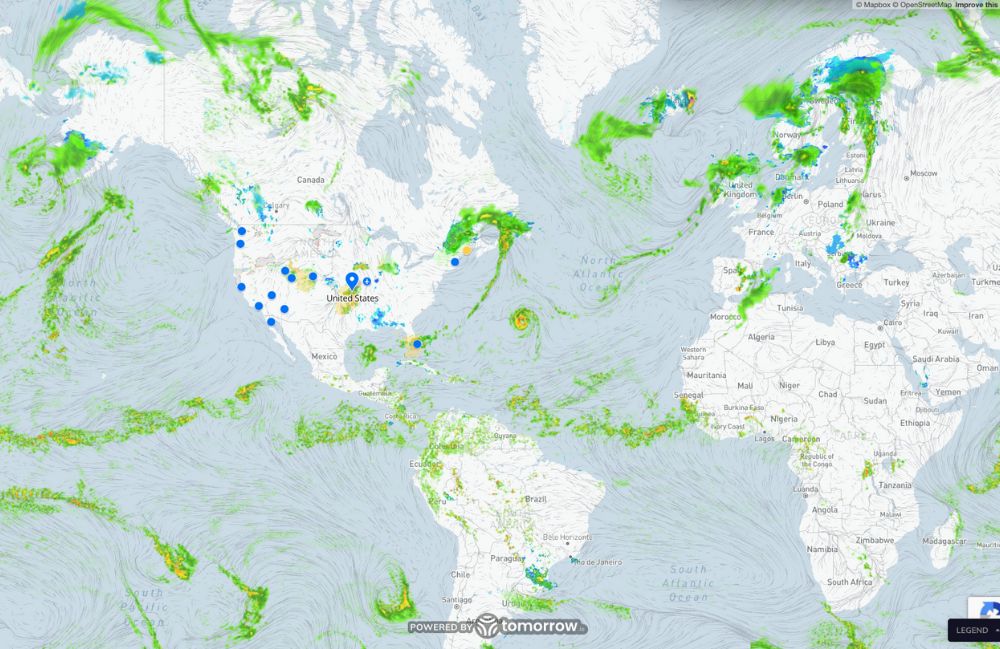
There are many ways to consume and integrate with forecast weather data, but one of the most popular is by visualizing those forecasts on an interactive map.
The Tomorrow.io weather API and available map tiles are purposefully built and designed to easily integrate with common interactive map libraries, including Google Maps, Mapbox GLJS, and Leaflet JS, for this exact reason.
We want to help make it simple to set up weather visualizations, and in this step-by-step guide, we’ll walk you through how to do that as a simple static webpage.
How Visualizing Global Precipitation Data Empowers Businesses
Precipitation data provides critical insights into weather patterns across the globe. By mapping and visualizing precipitation data, we can identify regions that receive high rainfall or snowfall, as well as areas experiencing drought. This data allows us to track climate trends over time and understand the impact of climate change on different parts of the world.
Access to global precipitation data allows businesses to make more informed decisions and plan for climate variability. Visualizing rainfall and snowfall patterns helps companies in industries like agriculture, transportation, renewable energy, and construction.
- Agricultural firms can optimize crop planning based on precipitation forecasts.
- Transportation and logistics companies can prepare for potential shipping delays caused by storms.
- Utilities can identify ideal locations for hydropower facilities and anticipate periods of low renewable energy generation.
- Construction firms can plan projects accounting for seasonality and the risk of extreme weather.
With our changing climate, leveraging precipitation data via geospatial mapping gives organizations a competitive advantage and resiliency.
How to Visualize Global Precipitation Data: Steps
1. Select Your Map Library
Before diving into the visualization, it’s crucial to choose the right map library. There are various options at your disposal:
- Leaflet JS: An open-source map library free to use.
- Google Maps: A widely recognized platform, although it requires sign-up and access to an exclusive key.
- Mapbox GLJS: Similar to Google Maps, Mapbox requires users to sign up for access.
After deciding, obtain your exclusive Tomorrow.io API key, which will be essential in the later steps.
2. How to Get Your Weather API Key
To begin building a weather app, you need to get your weather API key from Tomorrow.io.
Getting an API key from Tomorrow.io is easy; just sign up and create an account. When you create an account, your personal API key will be automatically created for you to use in your application.
After signing up, you are ready to make your first API call.
3. Choosing Your Data Fields
You’ll next want to decide what weather data you want to showcase on your map.
You can take a look at the detailed fields available in Tomorrow.io’s Weather Data Layers collection. Tomorrow.io offers API users more than 80 different data fields, including weather, air quality, pollen, and fire index.
These fields are designed to be compatible with the Map interface, ensuring smooth visualizations.
// pick the field (like temperature, precipitationIntensity or cloudCover)
const DATA_FIELD = 'precipitationIntensity';
You can view best practices for calling the Tomorrow.io API here.
4. Set Your Time Stamp
This step, while optional, can be valuable.
By default, the Tomorrow.io weather API will showcase data for the present moment. If there is no timestamp and format specified, the Tomorrow.io weather API will default back to “now” and “png.”
But if you wish to specify a particular time, ensure it’s in the ISO 8601 datetime format.
// set the ISO timestamp (now for all fields, up to 6 hour out for precipitationIntensity)
const TIMESTAMP = (new Date()).toISOString();
5. How to Initialize the Map
It’s time to bring your map to life!
Initialize it with the basic configurations such as viewport latitude/longitude and zoom preferences. For finer details and settings, refer to your chosen map library’s API documentation.
// initialize the map
function initMap() {
var map = newgoogle.maps.Map(document.getElementById('map'), {
zoom: 7,
center: {
lat: 42.355438,
lng: -71.059914
}
});
6. Injecting the File
Finally, add the call that injects the right roster tile of weather data according to the x, y, z, or zoom grid system.
If everything is set properly, including the keys, field, and timestamp, we should be able to see a colorized “heatmap” of the weather on the map.
// inject the tile layer
var imageMapType = new google.maps.ImageMapType({
getTileUrl: function(coord, zoom) {
if (zoom > 12) {
return null;
}

return `https://api.tomorrow.io/v4/map/tile/${zoom}/${coord.x}/${coord.y}/${DATA_FIELD}/${TIMESTAMP}.png?apikey=${API_KEY}`; },
tileSize: new google.maps.Size(256, 256) });

map.overlayMapTypes.push(imageMapType);
 }
Get More From Your Weather API
The Tomorrow.io weather API is not just a tool but an expansive gateway to harness the vast possibilities of weather data. As industries evolve, the integration of advanced weather APIs can redefine operations and strategies. Beyond mere visualizations, businesses can leverage this API for various applications:
- Operational Efficiency in Agriculture: Farmers can make informed decisions about planting, irrigation, and harvesting based on accurate and timely weather forecasts.
- Enhanced Travel & Logistics Planning: Transportation companies, whether air, land, or sea, can optimize routes and schedules, ensuring safety and efficiency in the face of impending weather conditions.
- Personalized Marketing Campaigns: By gauging weather patterns, retailers and e-commerce platforms can curate special promotions or products tailored to specific weather conditions.
- Real-time Event Management: From sports organizers to concert promoters, event planners can anticipate weather disruptions and make on-the-fly adjustments, ensuring attendees safety and experience.
There are many ways to interface with weather data, but of course, visualized maps are one of the most popular and commonly used.
Sign up for a free account today and start visualizing your own weather data!