Overseeing large-scale operations for almost any industry is a high-pressure role that requires having full visibility into what’s happening at any given time in any of your key locations or assets, and then being able to turn that visibility into speedy and appropriate action when needed.
For some industries in particular, like logistics and transportation, that operational visibility can be a real beast to achieve. Overseeing huge fleet networks operating in different locations with vastly different weather and environmental conditions is a dizzying effort to undertake.
That’s why the best operations professionals use Insights Dashboards to monitor weather conditions, powered by the Tomorrow.io Weather API.
Using the Tomorrow.io API, you can monitor and display forecasted weather events on your own dashboards, allowing you to visualize the most important and impactful events and take actions on those insights and forecasts.
Follow this step-by-step guide to monitor forecasted weather events through an insights dashboard. In this case, we’ll build a simple single page react web app to render on an operational dashboard, but the weather API is flexible enough to render on whatever dashboards you use.
1) Identify your dashboard format / component and get your key
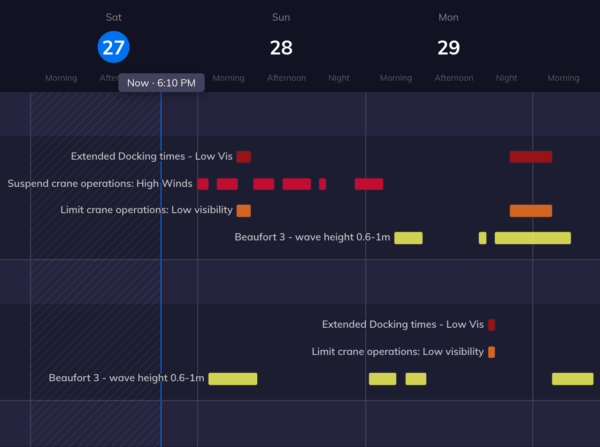
In this case, we’ll use a horizontal timeline component to show our weather events. We’ll take this from the free Google Charts library.
Once you’ve done that, get started by copying and adding your API key.
import * as React from "react";
import Chart from "react-google-charts";
import axios from 'axios';

class App extends React.Component {
2) Select your location
In this type of call, all types of location values are supported – be it a latlong pair, a locationID of a predefined location in the system, or GeoJSON geometry.
In your app, you can change these per query dynamically, through we chose to only get the weather data for one predefined location in this example.
3) List your insights
Insights queried for matching events can be either insight categories or IDs of predefined custom insights. However, to use custom insights, they must correlate with a predefined monitored location such that it is linked to an active alert (using the same insight ID). These can be requested in parallel with insight category names.
If you choose to query insight category names, you can also define a safety buffer around that location – to ensure that any nearby weather events are returned as well.
 // list the insights, can also include custom insights for monitored locations
      insights: ["winter", "wind", "temperature", "floods"],
      // set the safety buffer around the location, applicable only to insight categories only
      buffer: 20
  };
4) Request the events
Now that you have the basic weather parameters, you can make a request to the GET/POST events endpoint. The result JSON response will include a collection of all events that match the insights for the location.
In this example, upon completion of mounting the component, we made the call using axios. Once resolved, it updates the state of the React component. This will trigger another component update to render the events on the screen.
componentDidMount = () => {
    const props = this.props;
    const {insights, location, apikey} = props;
    // request all events matching the insights for the above-mentioned location
    axios({
      method: "post",
      // set the Events POST endpoint as the target URL
      url: `https://api.tomorrow.io/v4/events?apikey=${apikey}`,
      data: {
        location,
        insights,
      },
    })
      .then((response) => {
        console.log(response);
        this.setState({events: response.data.data.events})
      })
      .catch((error) => {
        console.log(error);
      });
  }
4) Render dashboard view
Now that we have the weather data, we can map all resolved events to an array structure according to the formats of the library we chose – in this case, the horizontal timeline component from Google Chats. There are many similar horizontal timeline libraries to achieve similar views.
render() {
    // configure unique colors, per severity level
    const colors = {
      "unknown": "#b6c0cc",
      "minor": "#ffff42",
      "moderate": "#ff7800",
      "severe": "#eb002c",
      "extreme": "#b80d0a"
    };
    let data = [
      // set the columns of the timeline chart, whereas Name is shown next to each bar and tooltip on hover
      [
        { type: "string", id: "title" },
        { type: "string", id: "Name" },
        { type: "string", role: "style" },
        { type: "string", role: "tooltip" },
        { type: "date", id: "Start" },
        { type: "date", id: "End" },
      ],
      // map all resolved events to the array structure mentioned above, in an orderly fashion
      ...this.state.events.map((event) => [
        event.eventValues.title,
        `severity: ${event.severity}   -   certainty: ${event.certainty}   -   urgency: ${event.urgency}`,
        colors[event.severity],
        this.renderTooltip(event.eventValues),
        new Date(event.startTime),
        new Date(event.endTime),
      ]),
    ];
    return (
{this.state.events.length > 0 && (
} data={data} options={{ tooltip: { isHtml: true }, colors: Object.values(colors), }} rootProps={{ “data-testid”: “7” }} />
)}
); } }
And that’s how you can set up a simple dashboard view to monitor the forecasted weather events you want – try it out for yourself for free!