The whole world has been watching in fascination as a massive cargo ship became stuck sideways in the Suez Canal, putting a halt on global trade through one of the world’s busiest routes for nearly six days.
Teams in Egypt have been working around the clock, trying to excavate the Ever Given from its horizontally wedged position in the canal. But how did it get stuck in the first place?
Surprisingly, it has everything to do with the weather.
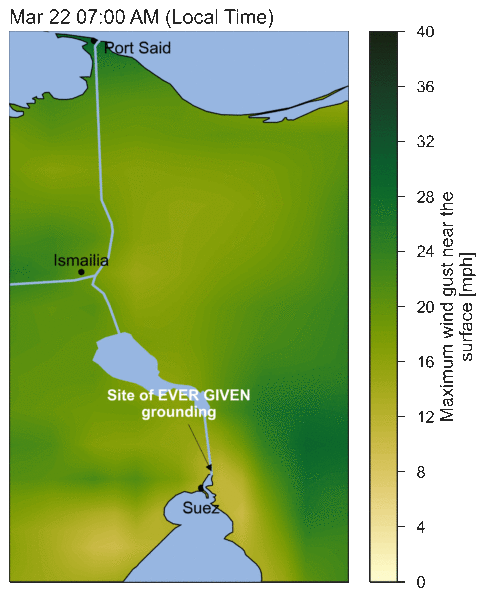
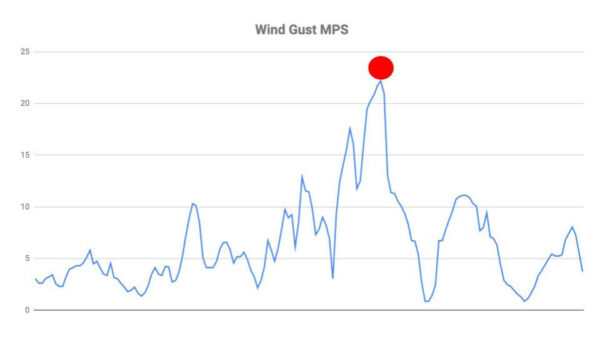
The graph below plots wind gusts on the day of the Suez Canal catastrophe. Note the red circle, as it’s exactly when the Ever Given ran aground.
The High Cost of Unusual Weather
We’ve all read the headlines by now, detailing the massive impact of this one ship running aground in the Suez. Every headline focused on the insanely large numbers:
- $400 million per hour in global trade being halted
- More than $10 billion in weekly cost
- 200+ ships unable to pass
- Livestock at risk
- Insurers on the hook for more than $100 million
- 30% of the world’s container freight goes through the Suez Canal daily
What a mess.
As we look back on the story of how things unfolded, we’re left asking the question: could this have been avoided? The answer is yes.
Our Weather Intelligence Platform was featured in both Bloomberg and Fortune this week, showing clear data that our software saw this incident coming and that it could have been avoided…but we’ll get to that in a bit.
What Happened on March 22 in the Suez Canal?
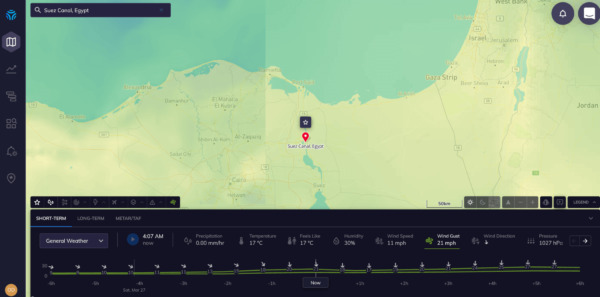
The below map shows the exact location of the Ever Given on the day of the incident.
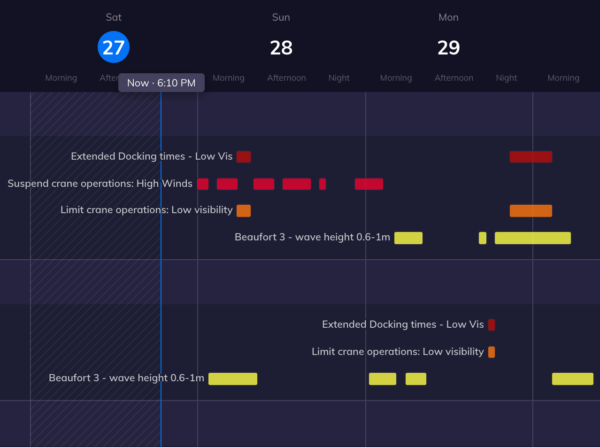
Seeing weather impact in advance with Insights Dashboards:
For teams across the supply chain operating with a Weather Intelligence Platform™, here’s an example of what they would have seen in the days and hours leading up to the Suez Canal catastrophe.
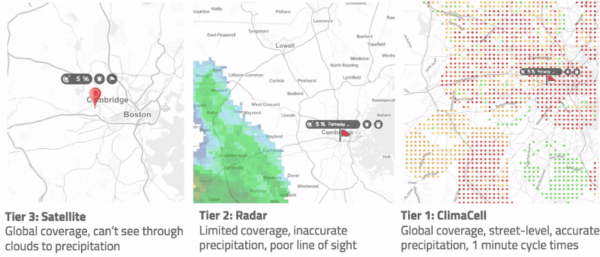
First, a hyperlocal look at more than 30+ weather parameters. In this case, wind speed, gusts, and direction.
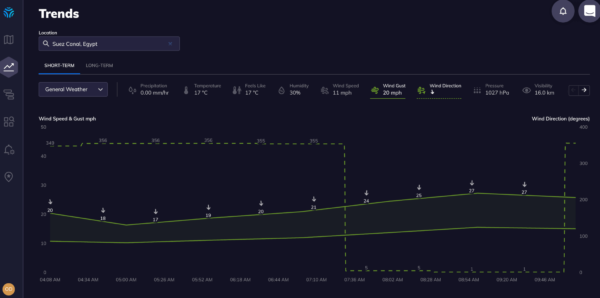
Second, a trend analysis showing the data behind the visualization.
Third and most importantly, an Insights Dashboard telling teams exactly when they would be at risk and providing specific recommendations on what to do.
Using an Insights Dashboard, the team would get instant alerts of the incoming wind, with plenty of time to make operational changes and avoid the disaster. But let’s go deeper by going back in time to understand what made this event even more difficult to foresee and predict.
Looking Back at a 20-year Analysis of the Suez Canal
As you can see in the below graphs, the wind speeds for this incident are slightly unusual.


The biggest takeaways from this data are:
- The average wind speed during February-March-April at the Suez port near the incident site is about 7 mph, with an average wind gust of up to about 15 mph
- The period of the strongest, gusty winds over 30 mph would be in the top 3% of wind gusts in the area over the past 20 years according to this historical weather dataset
- These values are estimated near the surface at about 10 meters. Given the size/height of the EVER GIVEN, it likely experienced substantially stronger winds on deck and impacting its cargo and bridge
Climate is the New Cybersecurity (But 10x Bigger)
You’ve heard us talk recently about how climate is the new cybersecurity for the C-suite, and the Suez Canal story is the perfect example. Executives without a climate resiliency strategy will continue to find themselves at the mercy of unexpected weather on a weekly and daily basis, continuing to put their entire business at risk.
The damages of the Suez Canal event include massive financial losses, revised growth forecasts, and also the careers of global executives.
And you might be next. It’s just a matter of time. It could be tomorrow, next week, or next month. Don’t wait for another “Suez Canal catastrophe” to happen to you.
Stop running your business at unnecessary levels of risk without knowing what will happen tomorrow. Implement a climate resiliency strategy today with our Weather Intelligence Platform™ to ensure the stability of your day-to-day operations across every aspect of your team and company. These climate events will continue to happen each week around the world, including unexpected weather and air quality hazards..

