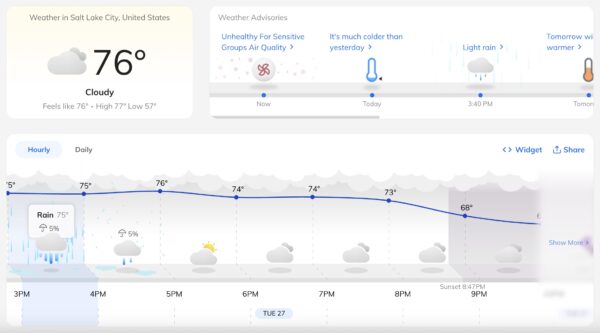
Tomorrow.io's Resilience Platform is Here. Learn More.

X
Tomorrow.io
By Tomorrow.io
Tomorrow.io
Tomorrow.io
Aug 19, 2020ยท 6 min, 57 sec

Data Analysis of Air Quality Before and After COVID-19 In Major Cities

Since COVID-19 spread around the world, its effects have been felt across all industries. Businesses in different parts of the world are changing the way they operate while governments and local authorities enforce a variety of measures to curb the spread of the virus — including prolonged lockdowns and travel restrictions.

The reduced movement and activities across major cities have resulted in a significant drop in pollution and an improvement in air quality. Almost all cities, including those that have always suffered the worst levels of air pollution, are recording a reduction in fine particulate matter, one of the deadliest pollutants.ย 

But what do the numbers really look like?

We analyzed the connection between COVID-19 and environmental variables in six major cities across the world: Los Angeles, Wuhan, Madrid, Delhi, Paris, and London.ย 

Data used throughout the article is collected from major government weather agencies as well as validated and reputable air quality monitoring stations. All data sources can be accessed through the Tomorrow.io Weather API.

With the Tomorrow.io API, you can fetch a number of air quality parameters including particulate matter, ozone (fuel and radiation), Nitrogen dioxide, Sulphur dioxide, and Carbon monoxide. This applies for both historical and real-time air quality data.ย ย 

The Tomorrow.io API also shows the air quality index based on US EPA standards as well as China MEP standards. All you have to do is provide the latitude and longitude for a particular city, then enter the fields youโ€™d like to check.

Delhi

Pandemic shutdowns have resulted in lower pollutant concentrations around the world. The Indian city of Delhi, which ranks fifth among the most polluted cities in the world, is a great example.ย 

After the Indian Prime Minister ordered a three-week lockdown affecting the movement of 1.3 billion people across the country, cities such as Delhi and Mumbai experienced their best air quality in years.

In the case of Delhi, we provide the city coordinates below.
Delhi Coordinatesย 

When fetching data from the Tomorrow.io API, we use 28.7041, 77.1025 as shown in the code snippet below:

const fetch = require("node-fetch");
require("dotenv").config();
const myApiKey = process.env.www.tomorrow.io_API_KEY;

function queryBuilder(request, options) {
  request += "?";
  Object.keys(options).forEach((key) => {
    if (typeof options[key] === "number" || typeof options[key] === "string") {
      if (request[request.length - 1] !== "?") {
        request += "&";
      }
      request += `${key}=${options[key]}`;
    } else if (Array.isArray(options[key])) {
      options[key].forEach((e) => {
        if (typeof e === "number" || typeof e === "string") {
          if (request[request.length - 1] !== "?") {
            request += "&";
          }
          request += `${key}=${e}`;
        }
      });
    }
  });
  return request;
}
async function getAirQualityData() {
  try {
    const url = queryBuilder("https://api.www.tomorrow.io/v3/weather/realtime", {
      lat: 28.7041,
      lon: -77.1025,
      unit_system: "si",
      fields: ["pm10", "pm25", "o3", "no2", "co", "so2"],
      apikey: myApiKey,
    });
    const res = await fetch(url);
    const data = await res.json();
    return data;
  } catch (err) {
    console.error("ERROR");
    console.error(err);
  }
}
(async function main() {
  const data = await getAirQualityData();
  console.log(data);
  setInterval(async () => {
    const data = await getAirQualityData();
    console.log(data);
  }, 60 * 1000);
})();

The Tomorrow.io API returns data for all air quality parameters supplied in the request.

www.tomorrow.io weather api air quality api

We found that Delhi saw a 60% drop in PM2.5 concentration in 2020 as compared to 2019 at the same time. As such, the cityโ€™s unhealthy rated hours dropped from 68% in 2019 to 17% following the lockdown.ย 

In Bawana, the most polluted area in Delhi, there was a significant reduction in PM2.5 which is the most prominent air pollutant in the city. The graph below shows the changes in the Air Quality Index (AQI) in Bawana, New Delhi from November 15th, 2019 to May 15th, 2020.ย 

bawana india air quality api

Mumbai saw a similar trend, recording a 34% reduction in air pollution from 2019.

Madridย 

Satellite imagery from the European Space Agency shows a sharp decline in the concentration of Nitrogen dioxide levels across Spanish cities during the lockdown period. In Madrid, for instance, the NO2 levels went down by 73%.ย 

When confinement measures were implemented from March 14th to March 25th, air pollution fell by over 50% from one week to the next.

Other cities in Spain also recorded a decline in air contaminants, with Barcelona recording an 83% drop while Valencia posted a 64% reduction in nitrogen dioxide levels.

Los Angelesย 

Los Angeles and the state of California at large were among the first regions to implement COVID-19 control measures in the U.S. Following the shutdown of activities and businesses starting March 19th, NASA reported a decrease in air pollution in Los Angeles.ย 

As illustrated in the graph below, the concentration of Nitrogen dioxide in the Long-Beach Route, located in one of the most polluted areas in Los Angeles, decreased by more than 50% between January and March 2020.ย 

long beach california air quality api

As nitrogen levels plummeted in the city, the usually obscured skyline was no more. The Institute of environment and sustainability at UCLA reported that air quality in Southern California improved by 20%.

During this time, Los Angeles enjoyed the clearest skies and longest stretch of fresh air quality since 1995, according to the United States Environmental Protection Agency. Noise pollution in downtown Los Angeles was at a record low. Traffic also plummeted as over 40 million California residents stayed at home.us covid 19 air quality impact 2020

This trend was seen in all major cities across the United States as shown below.

Parisย 

Like other cities, the greater Paris region witnessed significant improvement in air quality. This included a reduction in common air pollutants such as Nitrogen dioxide and Carbon dioxide.ย 

According to Airparif, an agency that monitors air quality in Paris, there was a 25 percent reduction in NO2 levels during the confinement period. Additionally, there was a 33 percent reduction in CO2 emissions, which indicates a strong relation between climate and air quality.

Airparif also noted that air pollution levels started returning to normal when the French government eased lockdown measures starting May 11th. With the gradual resumption of activities in the region, the concentration of N02 and fine particulate matter in the atmosphere went up, hitting around 80% of emission level before confinement.

Wuhanย 

Wuhan, the epicenter of the coronavirus pandemic, was put under a ten-week confinement period, shutting down industrial facilities and keeping over 11 million residents in their homes. During the lockdown period, PM2.5 levels in Wuhan went down by 44% from 2019.ย 

In a similar trend, Nitrogen dioxide concentration levels went down by 63% compared to the pre-lockdown levels. Regions with extensive factory clusters reported the highest decrease in NO2 levels, while the densely populated regions saw reduced traffic emissions.

wuhan china air pollution covid 19

However, following Wuhanโ€™s drive to kickstart economic activities, air pollution levels had risen back, going above the previous yearโ€™s levels when the government dropped the lockdown measures.ย 

The spike in pollution was true of fine particulate matter, sulfur dioxide, and nitrogen dioxide.ย  This is majorly due to a rebound in industrial activity.ย 

London

ย 

COVID-19 controls have also seen air pollution levels plummet across the Greater London region. Restrictions imposed starting March 24 resulted in a 9 to 17% drop in NO2 levels across the London network. In central London, air quality monitors registered an average reduction of 20 to 24%.

Below is a graph showing the average concentration of PM 2.5 and NO2 in London from mid November, 2019 to May 2020.

london england covid 19 air quality api

Road transport emissions are the greatest source of air pollution in London. However, the introduction of ULEZ policies, as well as lower traffic congestion, reduced roadside site pollution by around 44 percent.ย 

For instance, Marylebone Road, one of the busiest roads in the city of London, recorded a 48 percent reduction in daily average N02 levels. Similarly, Oxford Street saw a 47% reduction in daily NO2 levels. Throughout London, the greatest drop in NO2 from transport emissions was experienced during weekday commuting hours, especially in the morning and evenings.

However, London also had particulate matter pollution episodes during this time. These can be attributed to sources such as wood-burning and agricultural emissions from Mainland Europe.

Conclusionย 

It is evident that air pollution in major cities dropped significantly after imposing lockdown measures to slow the spread of COVID-19. People all over the world are celebrating a rare glimpse of nature characterized by fresh air, clear skies, and unimpeded views.

Although the confinement measures and reduced economic activity have translated into a clear reduction of air pollution, the benefits will unfortunately not be long-lasting. As with the case in China and other countries receding lockdowns, air pollution will climb back to pre-COVID levels.

You can learn more about environmental technology and the current pandemic by checking the Tomorrow.io COVID-19 resource center, which provides tons of resources for solving problems during the coronavirus crisis.

See Tomorrow.io in Action!

This site is protected by reCAPTCHA and the Google Privacy Policy and Terms of Service apply.

TOS(Required)

Sign Up for the Tomorrow.io Weather API for Free

Try Now