
The Q3 2026 release, from the release film.
Every operation asks the same question in its own words: which of my sites should I watch this week? This quarter the platform answers it about the things you actually run, then keeps going: into an event your workflows can act on, into a report someone else can read, and out to more of the world, in more languages.
Ask Gale about your assets, right on the map
Gale now answers about your own assets and about the events in our feeds: a named warehouse, a whole fleet, a specific storm. Ask which of your sites to watch this week and the answer comes back with the assets it names underlined, each one a step away from everything Gale knows about it.
Because Gale understands your assets’ attributes, an answer can branch the way your business does: by industry, by asset type, by where the exposure sits. Runways and freighter routes, substations and pipelines, berths and gantry cranes, rail yards and signal rooms. It all comes back together as an insights view of your own operation, in the same severity colors as your dashboard.

Insight events for your workflows
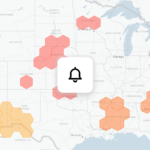
An answer is useful. An event your systems can act on is better. Alerts can now trigger on your assets’ own attributes, not only on the weather around them. A dispatcher can write “alert me on flights with under 60 minutes of fuel heading into thunderstorms,” a rule that wasn’t possible while alerts couldn’t see asset attributes. The same engine works for trucks in high winds and vessels in heavy seas.
Each event carries what the next step needs: the asset and its attributes, the window, where it is, the rule that triggered it, how likely it is, the actions it calls for, who is notified and who owns it. A new insight operator catches a threshold reached within a duration, and geospatial isolines now carry altitude as well as the surface. From a flight, an airport, a location or a storm, a contextual Gale button opens the impact analysis without typing a word.

Events are built to travel. With the MCP server and Custom Vector Events from the July release, the workflows and agents your team runs can take hold of an event, follow it as it changes, and do the work it calls for.

Expand your Gale chats into shareable reports
The conversation doesn’t have to end in the chat. Start a report from any answer: the insights view becomes the report’s first block, and Gale’s answer routes into the blocks around it. Add more, save it, and share it. The person who receives it opens the same report you built.

Also in Q3
New FOCUS model deployments. FOCUS, our regional decision model, now runs in Mexico, the Amazon, Chile and Argentina, West Africa and Indonesia. Each new domain gets what FOCUS brings everywhere it runs: a new run every 15 minutes, a 48-hour ensemble, and AI calibrated to our constellation1.

Bulk Timeline API. Request timelines for thousands of locations in a single order, and have them delivered as files to your own bucket or ours, once or on a schedule.

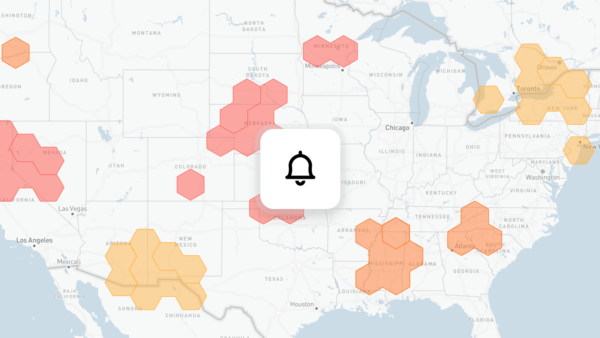
Tsunami alerts. Tsunami alerts from GDACS, the Global Disaster Alert and Coordination System, can now be shown on the map as an overlay2.

Multiple new languages. The platform’s translation keeps expanding, now including Spanish, Thai and Japanese.
Global service advisories in the mobile app. Severe weather advisories from around the world appear on the map in the mobile app, each with its details a tap away.

Lite Map. Your saved locations and assets now appear directly on the fast new map, and our own proprietary layers are on it too, not just the public models.

New weather layers. The map gets new layers: probability layers, new ECMWF altitudes and layers for expert use and skew-T display, density altitude at the surface, and new satellite layers.

And, of course: an endless amount of blocks
A block is a small application that brings a data source, the decision logic and a view together for one job: airport conditions, a lightning countdown, a diversion assessment. Teams describe what they need in AI Studio and Gale assembles it, and the library grows every day with the blocks you build. We love every one of them.

The quarter in orbit and in models
Between July 1 and September 30, our microwave sounders recorded 28,437,148 scans of the atmosphere3. Each scan is one sweep of a sounder across its path. On October 1, after the quarter closed, two more sounders went up: Tomorrow-S12 and S13, aboard SpaceX’s Transporter-184.

Sky 1, our atmospheric state model, draws a fresh global picture of the atmosphere every hour5.

RE-FOCUS, introduced on September 28, is the model for what already happened: an AI model that rebuilds past weather at storm scale, over periods that are already over. For US storms, it redraws a single event on a three-kilometre grid, hour by hour, anchored to the station readings and storm reports the event left behind, and runs it as 20 versions of the storm, so you see the most likely gust and the spread around it6. It doesn’t replace anyone’s risk model; it gives that model a sharper history of what happened.

What’s next
Stay tuned for the Altitude release: our dedicated product for aviation has its own update coming. And something else exciting is on its way.
Explore the release in the platform.
Sources
- Tomorrow.io (September 8, 2026). The Models: FOCUS. A new run every 15 minutes, out to 48 hours; calibrated to the constellation, public observations and your own sensors.
- GDACS. Global Disaster Alert and Coordination System. The source of the tsunami alerts shown on the map.
- Tomorrow.io (October 2026). Count of processed microwave-sounder scans, July 1 to September 30, 2026.
- Tomorrow.io (October 1, 2026). Tomorrow-S12 and S13.
- Tomorrow.io (August 5, 2026). Introducing Sky 1: The Atmospheric State Model.
- Tomorrow.io (September 28, 2026). RE-FOCUS — The Model For What Already Happened.