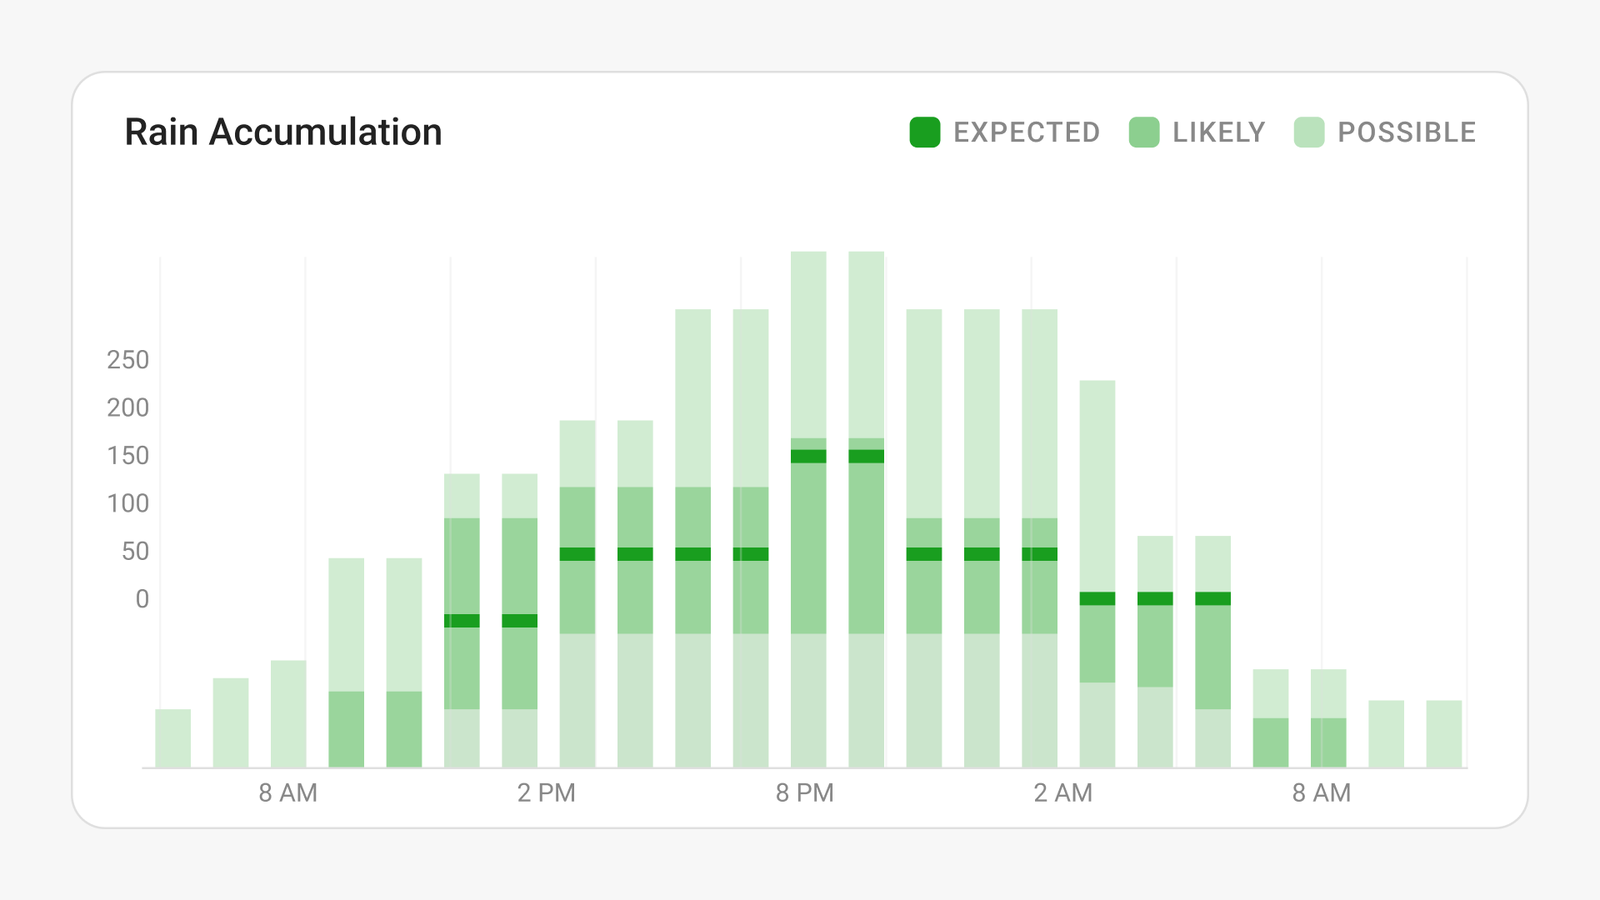
Rain and snow shown as a range — expected, likely, and possible — for every hour, not a single number. The actual accumulation view.
This release stops handing you a single number for rain and snow, and starts showing you the whole range. It’s a small change on the screen and a large one in the decision — because the number you plan around was almost never the average.
What shipped: accumulation, as a range
Rain and snow accumulation drive some of the highest-consequence calls an operation makes — whether to stage crews, pour concrete, pre-treat roads, or close a crossing. Until now, most tools handed you the least useful version of that forecast: one number. This release makes accumulation probabilistic. For any hour, you see the full envelope — what’s expected, what’s likely, and what’s possible — on the timeline, in trends, on the dashboard, and in reports.
You never see this on the evening news. The news gives you one number, because it’s talking to everyone and no one. The range is for someone with a decision to make.
Why one number fails you
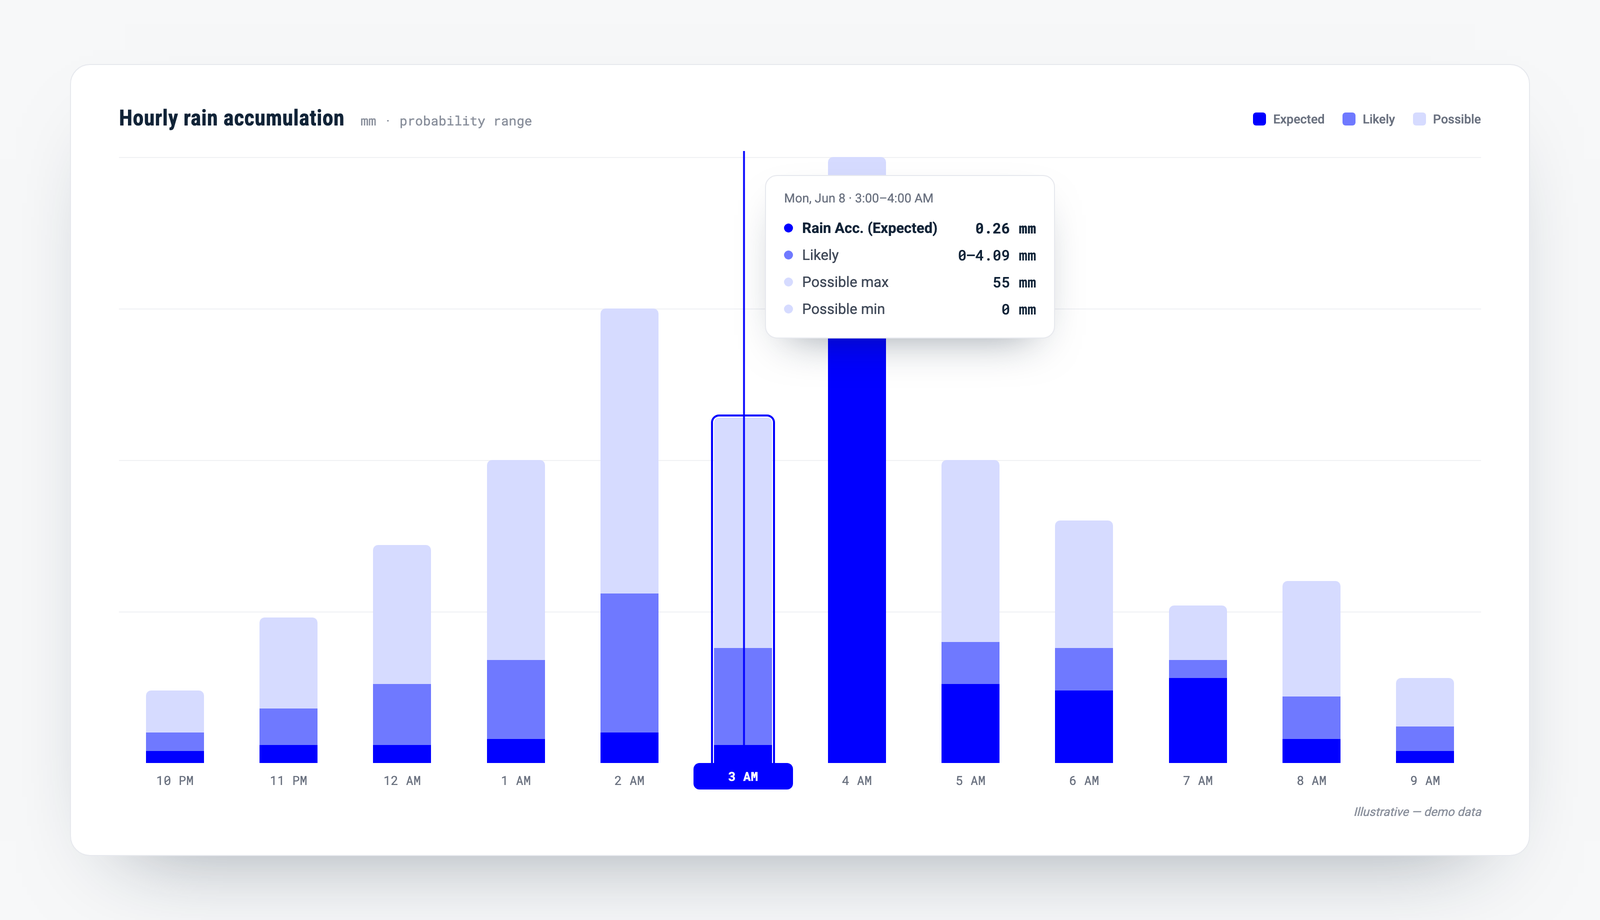
Look at what the range exposes. The expected accumulation for that hour is about a quarter of a millimeter — nothing. The possible max is 55 millimeters — a two-hundred-fold difference in the same hour, on the same forecast. A single-number tool shows you the quarter-millimeter and moves on. But no one staging flood response acts on the expected value; they act on the credible worst case — and that worst case was simply invisible before the range made it visible.
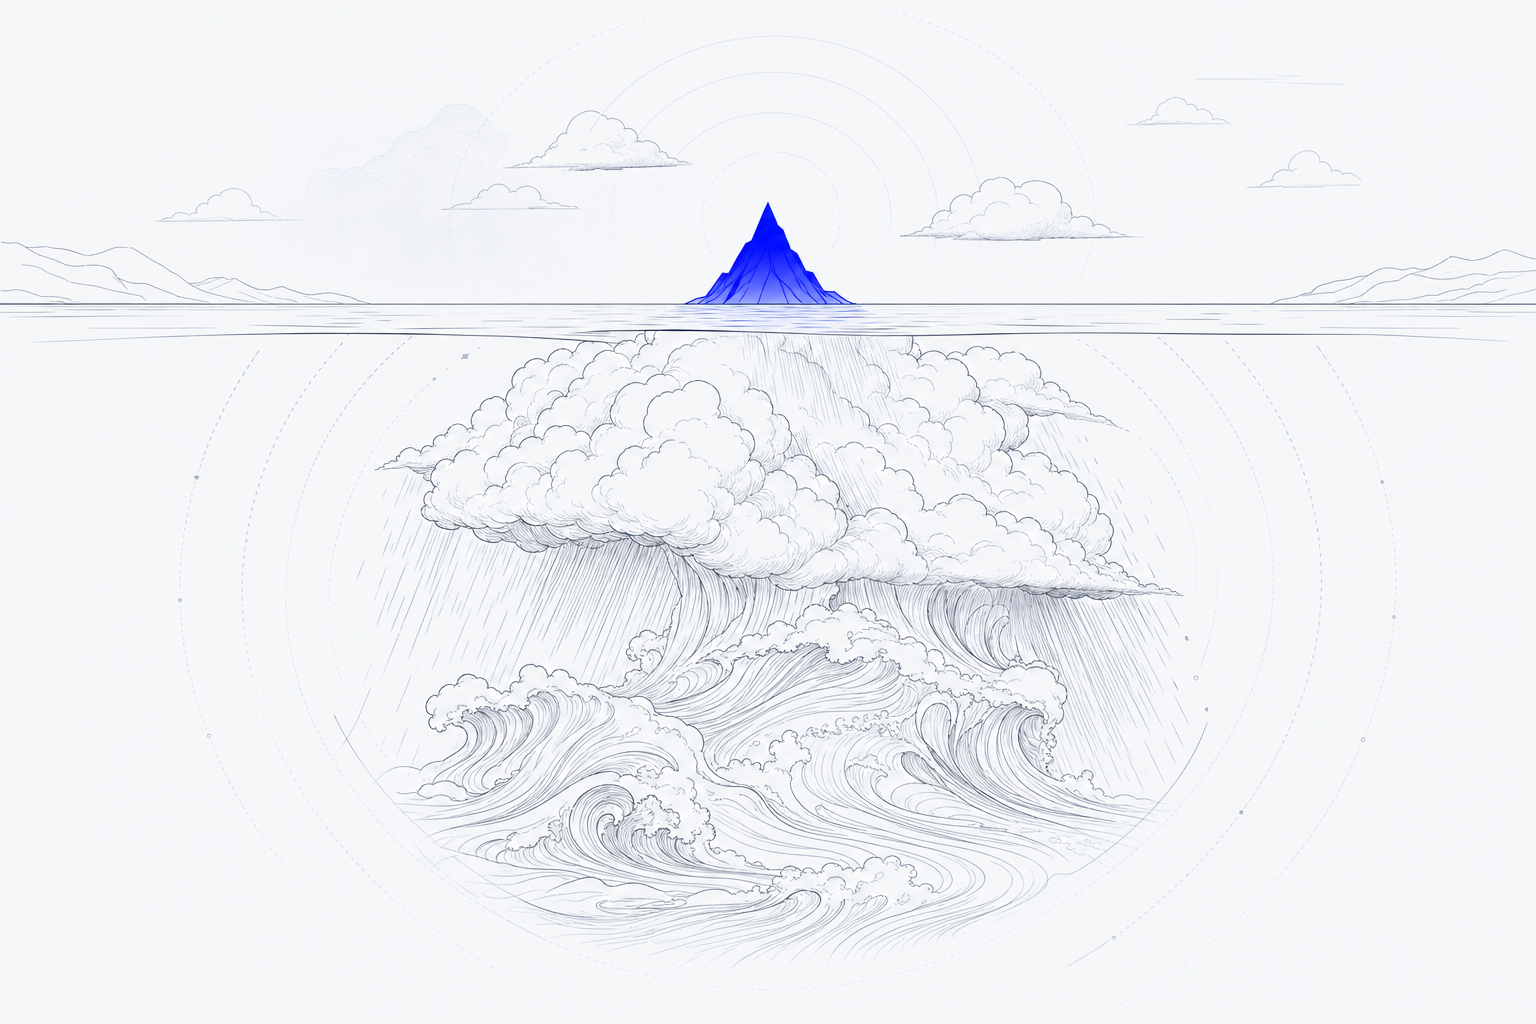
That’s the whole point of a range. Not to tell you the single most likely amount, but to show you the spread — so you can find your threshold inside it and decide how far to lean. A 20% chance of an inch of rain is a footnote to one team and a five-alarm morning to another. The forecast is identical. What differs is everything the forecast doesn’t know about you.
The same range, different stakes
Hand the exact same accumulation forecast to four operations and you get four different decisions — because accumulation doesn’t land on the weather, it lands on you: on what you’re standing on, what you’re carrying, and where your low point is.
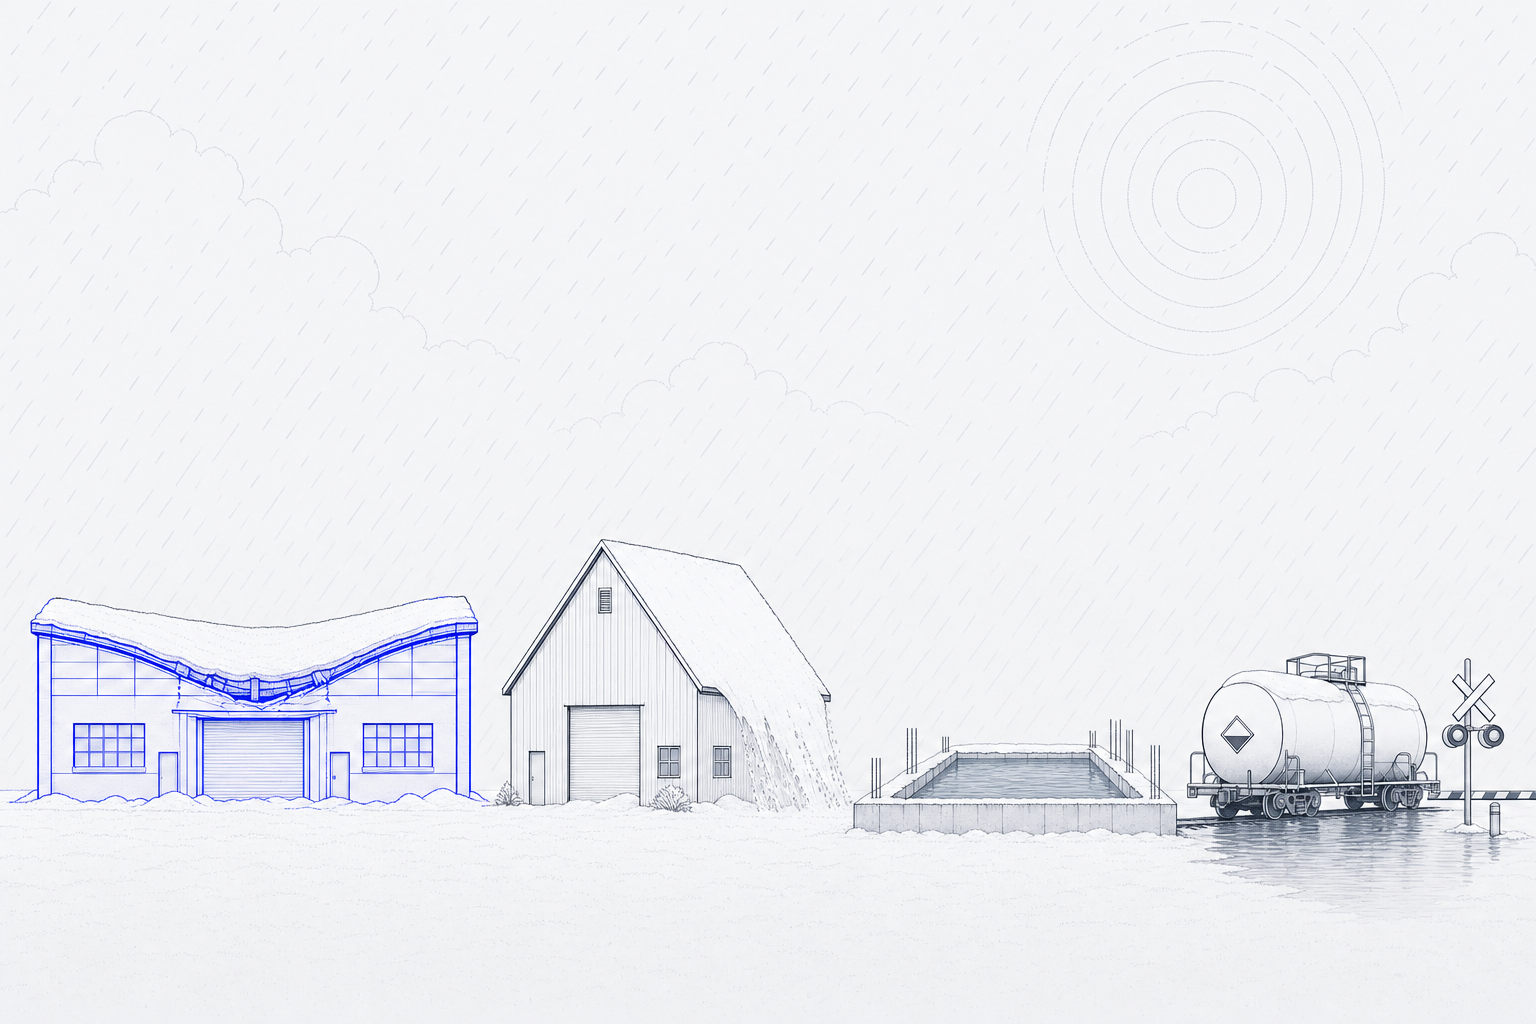
- The age and rating of a roof — two inches of wet snow is a plowing job on a new pitched roof and a load-rating question on an old flat one.
- What the ground is doing — the same three inches of rain runs off a graded lot and fills an open foundation pit, drowning the pour and the schedule with it.
- What the lines are carrying — a half-inch of ice is a non-event on a bare span and a downed circuit on a loaded conductor.
- Where the low point is — the rain that’s a puddle on high ground is a closed crossing at the dip where a tank car of chemicals is waiting to move.
None of that is in the forecast, and none of it should be. The forecast’s job is to be right about the sky. Your job is to know what the sky costs you — which accumulation threshold matters, on which asset, to which person.
The decision is out on the tail
There’s a reason the possible max matters more than it looks like it should: the downside is rarely symmetric. For most operations, being caught unprepared costs far more than preparing for a storm that softens. A utility that under-staffs an ice event drags out an outage, breaches a reliability standard, and answers to a regulator. A utility that over-staffs pays some overtime on a quiet night. Those two mistakes are not the same size — and when they aren’t, you don’t plan for the average. You plan for the bad case inside the likely range: not the freak tail nobody can forecast, but the worst plausible accumulation you can actually see coming.
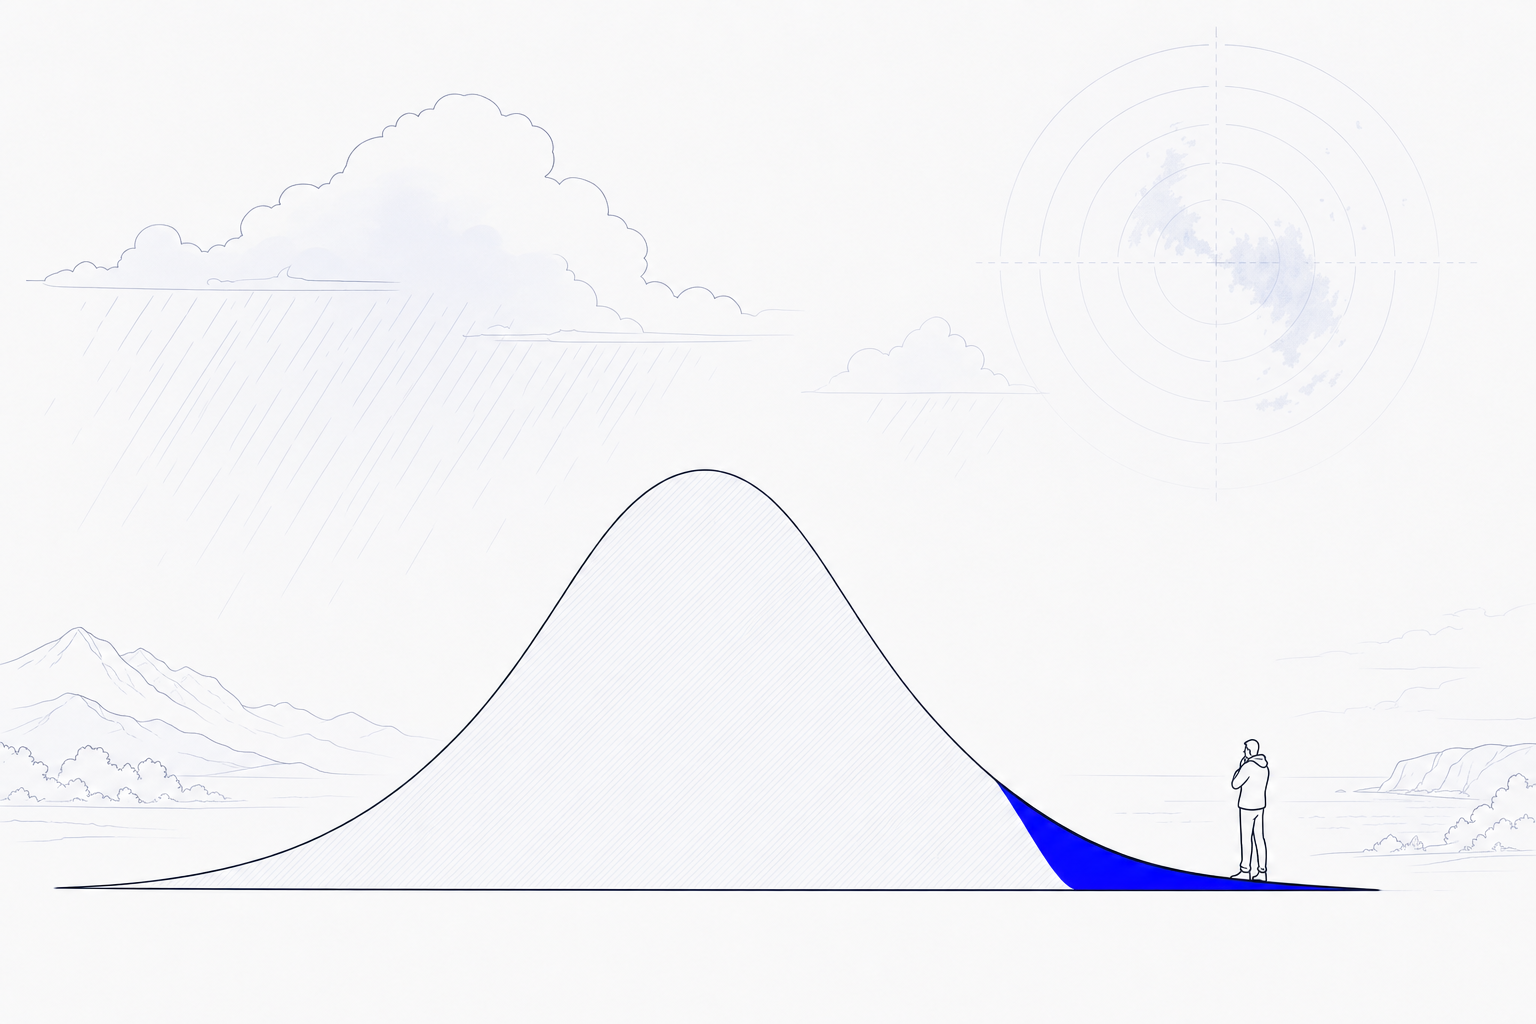
A single number can’t show you that tail. A range is built to.
Probability is an input. Confidence is what you build around it.
Seeing the range is necessary. It is not the same as being ready to act on it. It’s tempting to treat a sharp probabilistic forecast as confidence — but a perfectly-drawn envelope that reaches no one who can act, with no plan for what to do and no time left to do it, produces exactly zero confidence. Confidence isn’t a property of the forecast. It’s what an operation assembles — and the range is only the first piece of it.
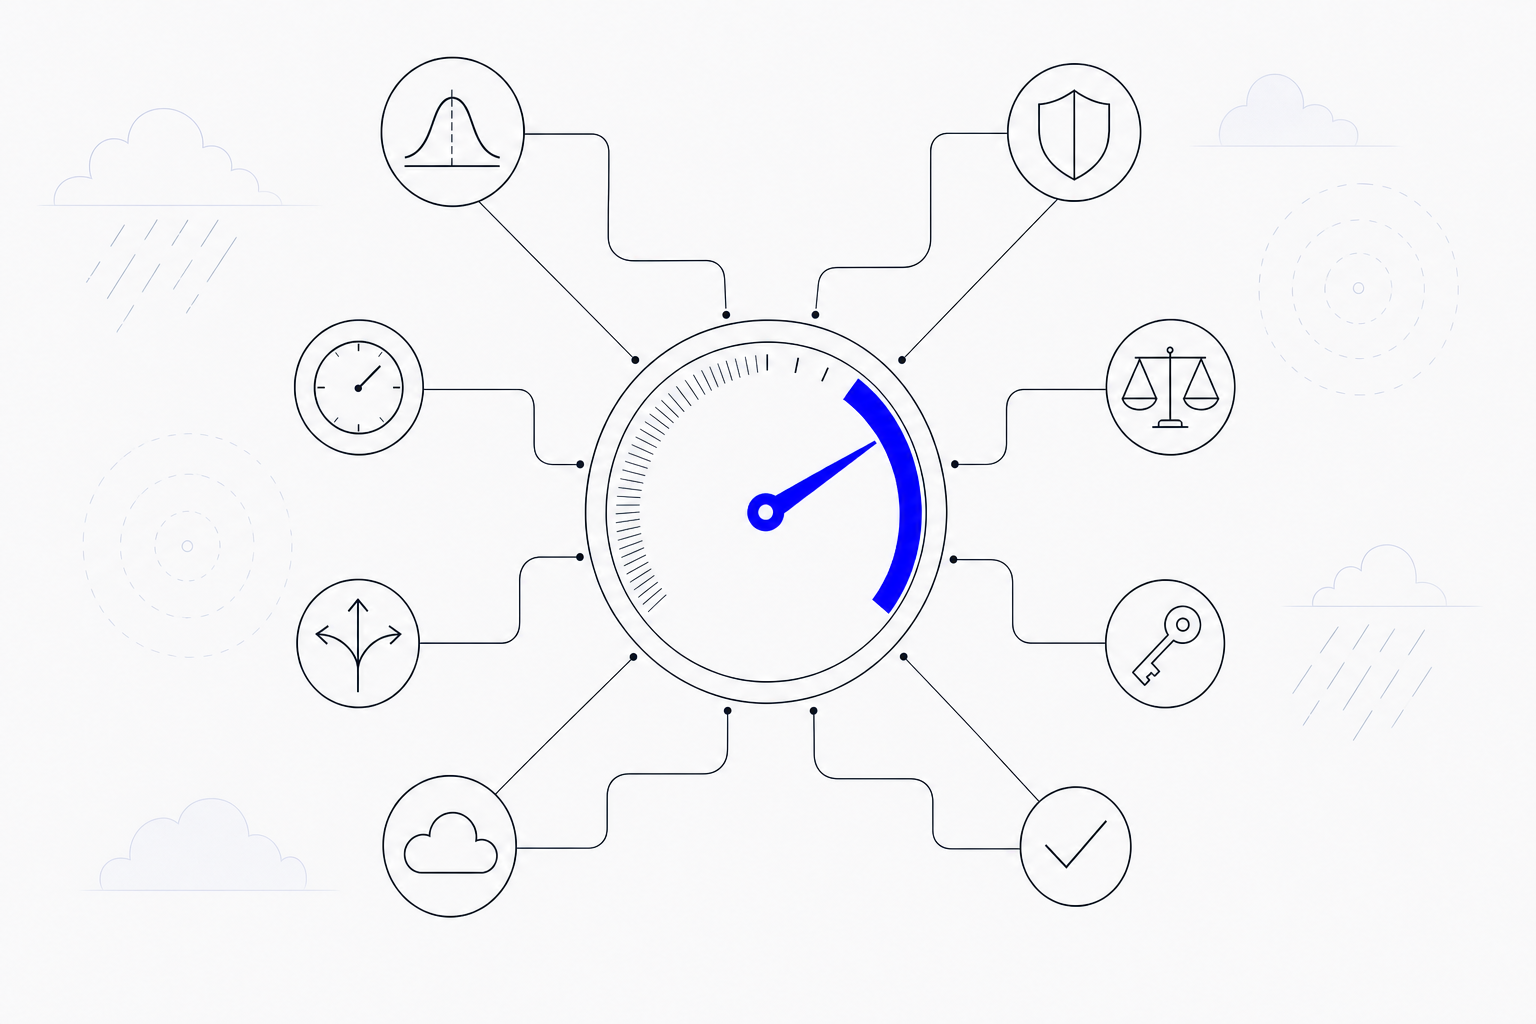
Confidence is really the answer to four questions, resolved closely enough, at the same time, that you can say: now — I act now.
1. How much will actually fall?
This is where the range starts — the expected, likely, and possible amounts. But you also need to know how much to trust it: a forecast of this type, at this lead time, is more reliable for some parameters than others. And whether you’ve stood here before — have I seen this pattern, and what happened last time?
2. If that much falls, will it hurt me?
The exposure question, and it splits three ways: whether you’re actually vulnerable at that accumulation (the old roof, the open pit, the loaded line), what’s at stake either way (the cost of being wrong and the cost of being right and unready), and what you can tolerate — can you live with a false alarm, and can you survive a miss?
3. Can I still do something about it?
A perfect read is worthless once the moment to act has passed. How much agency do you still have, how long until your best option expires — the crews you can’t stage in the last six hours before onset, the pour you can’t un-pour — and, quietly the sharpest one: is waiting improving your position, or destroying it?
4. Am I allowed to act — and covered if I’m wrong?
Someone has to be permitted to make the call, and willing to make it. There has to be a protocol — do you know the move at each threshold, or must you invent it under pressure? And there has to be cover: if you pre-stage for the possible max and the storm comes in at the expected, can you defend the decision you made with the information you had?
Confidence is what you have when all four resolve at once. A flawless accumulation range with an unresolved will it hurt me is a well-measured shrug. A flawless range with no authority to act is a memo. The number is necessary. It is nowhere near sufficient.
A forecast hands you a range. The work is helping resolve everything else the range can’t.
That is the real bar. The reliability, the exposure, the lead time, the options still open, the protocol, the person who can say yes — those are the dimensions that turn a probability into a decision. Showing the range is the part that had been missing; it is also just the first step.
Where the range comes from
A range is only as trustworthy as the observations beneath it. A forecast that’s honest about its spread is worth more than a false-precision point — but only when that spread is grounded in real measurement, not padded with guesswork. That grounding is why Tomorrow.io builds its forecasts on its own satellite constellation: microwave sounders that observe the atmosphere directly, over the wide stretches of ocean and remote land where ground stations simply don’t reach.
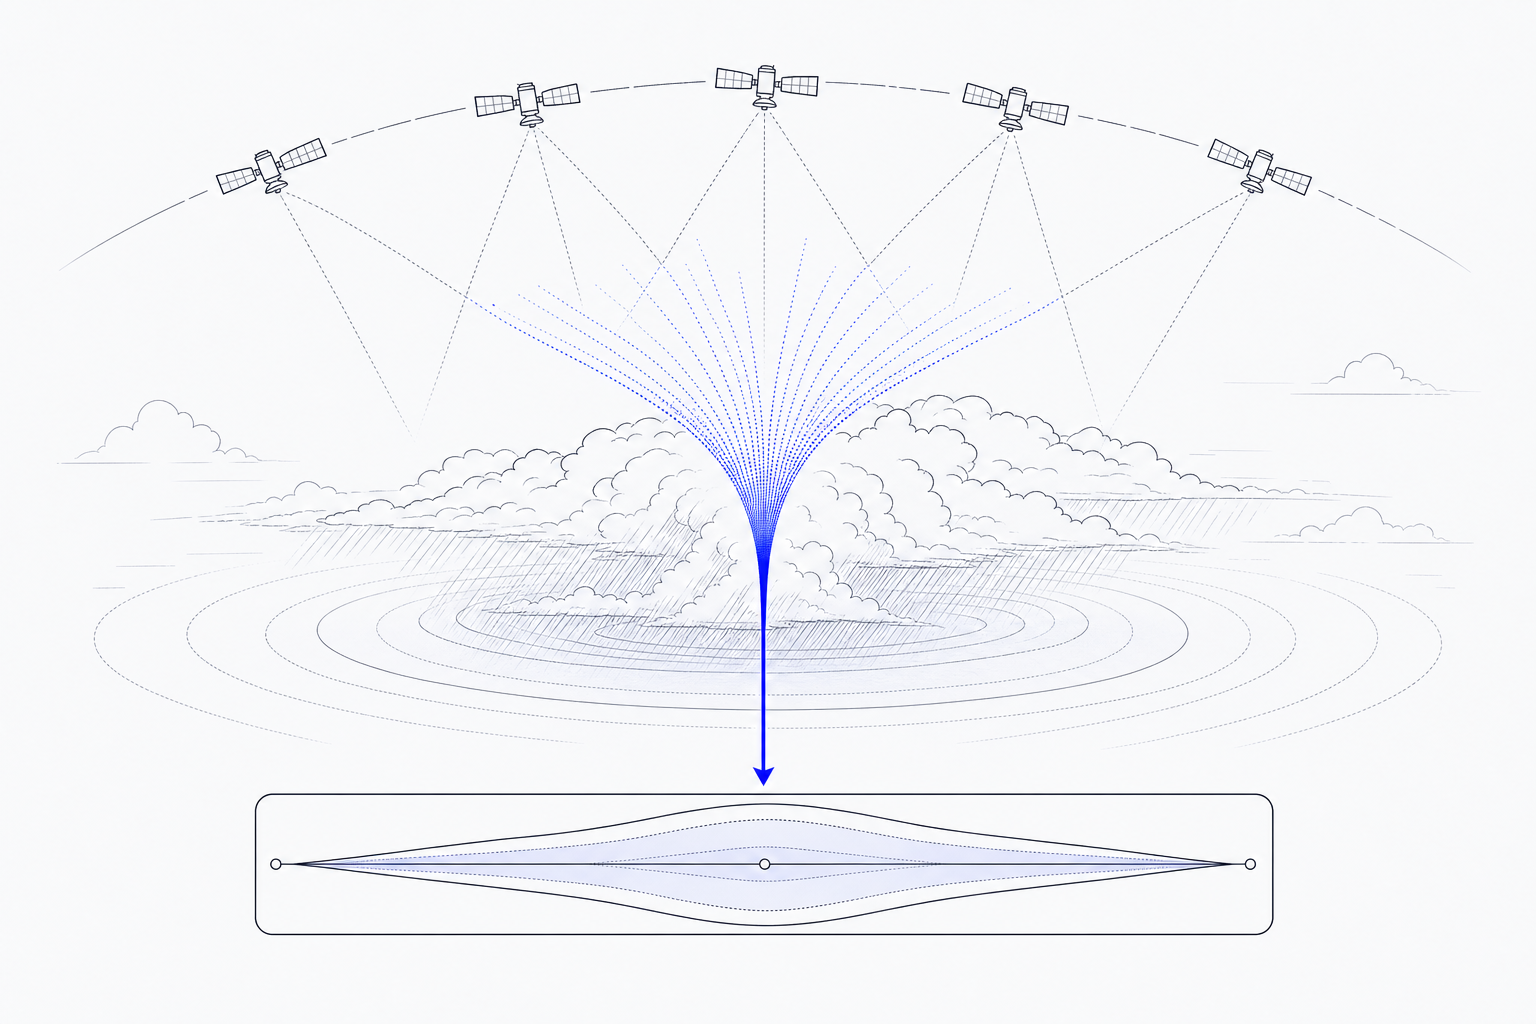
This release brings that layer into the open. Our own satellite products — brightness temperature, water paths, storm-top height, temperature and humidity profiles — are now visible directly in the platform, alongside a set of expert data layers for the forecasters who want to read the atmosphere in depth. When you act on a range, you’re not taking a black box on faith: the measurements the forecast is built on are right there to inspect. Confidence in the number starts with being able to see where the number comes from.
The map behind the read
Handing each operation the right part of the range means knowing, in advance, which part is theirs. That’s the work behind the Weather Value Graph: for each industry and segment, the accumulation thresholds that actually bite it, the decision each one forces, which way the regret runs, who has to clear the move, and how much lead time it needs. It’s why the same snowfall forecast resolves to a plowing schedule for one operation and a roof-load decision for another — one number, many prices.
Read by industry
The range is the same everywhere. What each operation does with it is not — because each reads a different part of it, against a different threshold, on a different clock:
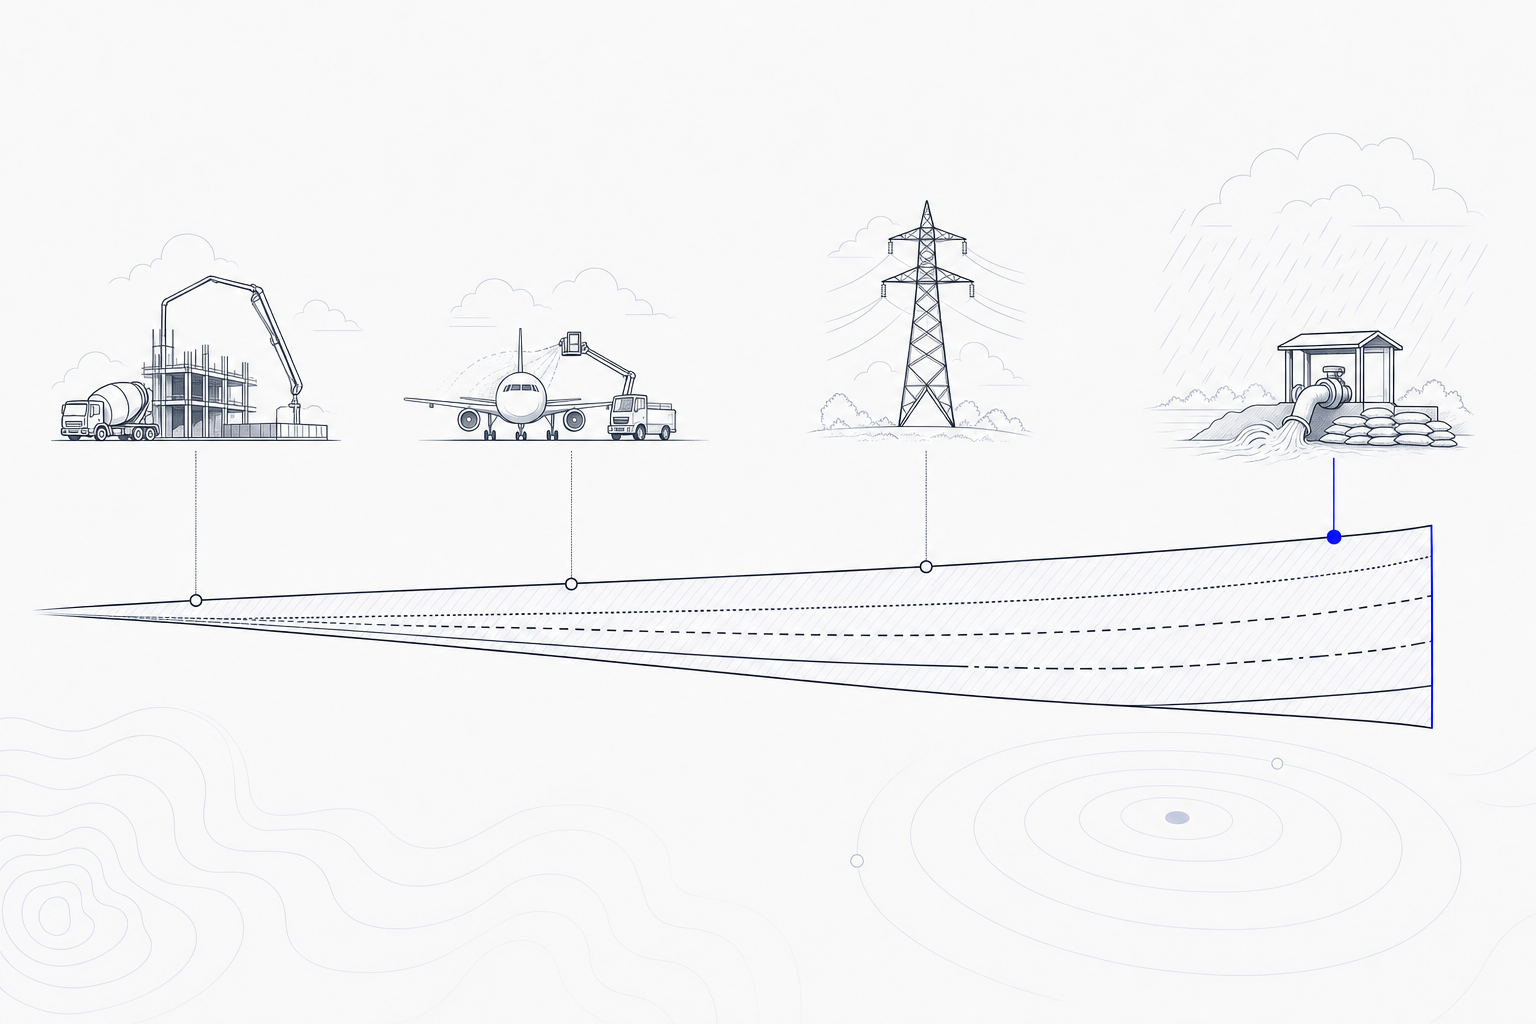
- Flood-response agencies read the possible max. Staging crews, sandbags, and pumps takes hours to a day; the expected value can’t justify that mobilization, but the credible worst case can. The range is what lets them pre-position early — while the option is still open — rather than react once the water is already up.
- Electric transmission & distribution reads the ice envelope. Ice loading on conductors is the costliest event class a grid faces, and crews can’t be moved into position in the last hours before onset. The possible-max ice accumulation, seen a day or two out, is the difference between pre-staging mutual aid and a multi-day outage.
- Aviation ground operations read the likely snow band. De-icing crews, fluid, and gate plans are sized to what’s probable, not to a single deterministic number — and the range tells a hub whether to staff for a dusting or a shutdown.
- Construction and roads read the expected against the possible. A pour, a lift, a pre-treat run — each is a one-way door; if the expected is dry but the possible includes a soaking, the range is what turns a coin-flip into a defensible go/no-go before the trucks roll.
Same distribution. Four different decisions. That’s what showing the range does that a single number never could: it doesn’t make the call for you — it hands each operation the one part of the forecast that its own exposure makes load-bearing.
The number is the same for everyone. What it’s worth is yours.
A forecast is a fact about the sky. A decision is a fact about you — your exposure, your tolerance, your options, your authority, and your clock. Accumulation probability is where the two finally meet on the screen: not a single number that means the same nothing to everyone, but a range each operation can read against its own worst plausible day. It won’t make the call for you. It will make sure the call is yours to make — in time, with the number that actually matters to you already in hand.
▽