Introducing Sky 1: The Atmospheric State Model

X
Tomorrow.io
By Tomorrow.io
Tomorrow.io
Tomorrow.io
Aug 11, 2026· 24 min

The Two Weeks the Market Can’t See

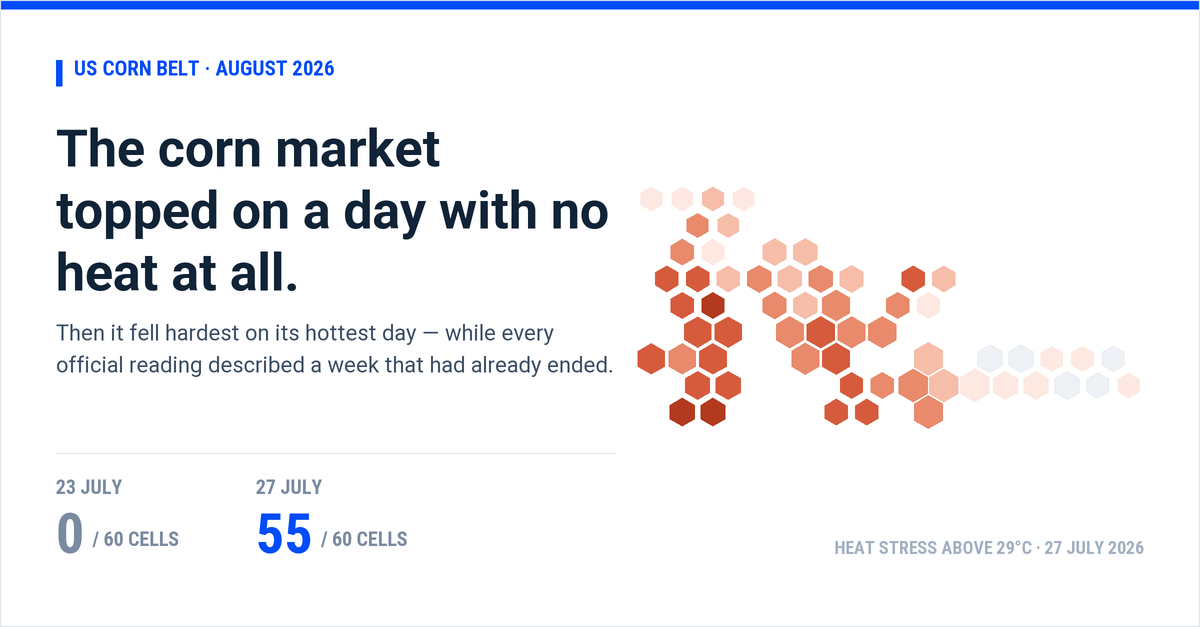
The corn market topped on a day with no heat at all — a hex map of the US Corn Belt showing 55 of 60 production-weighted cells above the 29°C heat-stress threshold on 27 July 2026
Tomorrow at noon Eastern, USDA publishes its first survey-based corn yield of the season — a number built from what surveyors saw in fields on and around August 1. Monday’s condition report described the week that ended August 9. The Pro Farmer tour walks next week counting ears, which July already finished setting. Meanwhile the crop is 94% silked and moving through grain fill right now, and the two weeks that decide what those kernels weigh have not happened yet. This is a dated read of that gap, and of what the market did the last time it opened.

Tuesday, 11 August 2026. Weather figures are computed from a 60-cell production-weighted Corn Belt grid — observations through August 11, forecast after. Prices are CBOT December 2026 corn settlements through August 10, the last settled session.

What the market gets told this week, and when

The crop is 94% silked, 61% at dough, 16% dented — and running ahead of its own five-year averages of 55% and 12%. That phenology matters more than it sounds, because corn yield is two things multiplied: how many kernels there are, and how much each one weighs. Kernel number was set at pollination, in July. Kernel weight is being set right now. Heat in July killed kernels. Heat in August shrinks them — a smaller effect per degree, but it lands on a component that nothing in the market’s information calendar is currently measuring, and it lands on a crop that is further into grain fill than usual for the date.

This week the industry runs three of its biggest rituals. Each is rigorous. Each describes a stretch of time that has already happened.

WHAT EACH INSTRUMENT SEES — AND WHEN IT SPEAKSBar = the span of crop state the reading describes. Dot = the day it publishes.THE RIDGENASS Crop Progresslast week’s conditionNASS Crop Progress — observes 2026-08-03 to 2026-08-09; publishes 2026-08-10. condition of the week that ended August 9, published August 10NASS Crop Progress publishes 2026-08-10August WASDEconditions as of ~Aug 1August WASDE — observes 2026-07-25 to 2026-08-01; publishes 2026-08-12. first survey-based yield estimate — field conditions as of roughly August 1, published August 12August WASDE publishes 2026-08-12Pro Farmer Crop Tourthe kernel count July setPro Farmer Crop Tour — observes 2026-07-05 to 2026-07-31; publishes 2026-08-20. ear counts and kernel rows — the kernel number, which pollination in July already finished settingPro Farmer Crop Tour publishes 2026-08-20Drought Monitorthe July 30 snapshotDrought Monitor — observes 2026-07-24 to 2026-07-30; publishes 2026-08-07. the July 30 soil-moisture snapshot referenced across the trade pressDrought Monitor publishes 2026-08-0714-day forecastthe next thirteen days14-day forecast — observes 2026-08-12 to 2026-08-24; publishes 2026-08-11. issued August 11, and the only window here that contains the days now setting kernel weight14-day forecast publishes 2026-08-11JUL 1JUL 15AUG 1AUG 12AUG 24
Four of the five bars end before the shaded window begins. Each institutional reading is honest about a stretch of crop state that has already happened; the tour measures the kernel count July finished setting. Only the forecast row covers the days that set this crop’s finishing weight.
Aug 10
Crop Progress. Condition for the week that ended August 9 — published the day after it closed, and describing a week that ended before the ridge.
Aug 12
WASDE. The first survey-based yield estimate of the season, built from field conditions as of roughly August 1. The trade expects 182.5 bu/ac against the 183.0 USDA has carried unchanged since May.
Aug 17–20
Pro Farmer Crop Tour. Scouts walk Indiana, Illinois, Iowa, Nebraska and Minnesota counting ears and measuring kernel rows — the kernel count, which July already finished setting. They will be walking through the ridge while measuring the thing it cannot change.

None of that is a flaw. A survey has to close before it can be published; a tour has to count something countable. But it means that for the next two weeks, the only instrument in the room whose window contains the days that set this crop’s finishing weight is the forecast.

The last time that gap opened, the market moved first

December corn settled at $4.30 on June 29, the lowest close of its season, and traded as low as $4.2575 the following session. From there it rallied 57.5 cents to close at $4.875 on July 23, touching $4.92 intraday on July 24. By July 23 managed money held roughly 100,000 contracts long. Then the rain forecasts improved, the premium came out, and the contract settled at $4.6175 on August 10.

Now look at when the confirmation arrived. The rally ran through the week ending July 19 — a week USDA rated the crop 67% good-to-excellent, unchanged and unremarkable. The rating did not start falling until the print covering the week the heat had already finished. The market moved first; the reading caught up afterward.

Rally off the low57.5¢June 29 to July 23, settlement basis, as heat built during pollination
Condition lost−6 pts67% to 61% good-to-excellent over four weekly prints (USDA NASS)
Premium still standing31.7¢Above the June low, after 26¢ came back out on the rain forecasts

An analyst put the mechanism plainly in early July, before any of it had happened.

Futures will respond long before combines enter the field. Randy Thompson, market analyst, quoted in Agweek, July 2026

He is right, and the chart below is what it looks like. The top panel is every daily settlement of the December contract. The bottom panel is heat stress measured across a production-weighted grid of 60 cells in 11 states — the accumulated degrees above the 29°C threshold at which corn’s yield response turns sharply nonlinear. Both panels share one time axis, so a session and the weather it traded through sit on the same vertical line.

FORECAST →DEC ’26 CORN — DAILY SETTLEMENT ($/bu)Every settled session from May 1 to August 10, CBOT.4.254.504.755.00MAY HIGH $5.06½2026-05-01 · settle $4.9875 · high $5.0175 · low $4.92252026-05-04 · settle $5.045 · high $5.0475 · low $4.9652026-05-05 · settle $5.005 · high $5.0575 · low $4.9752026-05-06 · settle $4.90 · high $4.995 · low $4.87752026-05-07 · settle $4.895 · high $4.915 · low $4.832026-05-08 · settle $4.935 · high $4.95 · low $4.87252026-05-11 · settle $4.9775 · high $4.985 · low $4.932026-05-12 · settle $5.02 · high $5.0325 · low $4.93752026-05-13 · settle $5.03 · high $5.065 · low $5.02026-05-14 · settle $4.9125 · high $5.0525 · low $4.892026-05-15 · settle $4.81 · high $4.9675 · low $4.80252026-05-18 · settle $4.98 · high $4.99 · low $4.88752026-05-19 · settle $4.9775 · high $5.0075 · low $4.94252026-05-20 · settle $4.8925 · high $4.995 · low $4.85752026-05-21 · settle $4.85 · high $4.92 · low $4.8352026-05-22 · settle $4.865 · high $4.9025 · low $4.842026-05-26 · settle $4.82 · high $4.8725 · low $4.802026-05-27 · settle $4.775 · high $4.8425 · low $4.772026-05-28 · settle $4.8225 · high $4.84 · low $4.7652026-05-29 · settle $4.75 · high $4.85 · low $4.7352026-06-01 · settle $4.725 · high $4.7725 · low $4.68752026-06-02 · settle $4.665 · high $4.7375 · low $4.6552026-06-03 · settle $4.5975 · high $4.6875 · low $4.5852026-06-04 · settle $4.5175 · high $4.595 · low $4.502026-06-05 · settle $4.46 · high $4.525 · low $4.44752026-06-08 · settle $4.46 · high $4.4975 · low $4.412026-06-09 · settle $4.4525 · high $4.515 · low $4.43752026-06-10 · settle $4.4675 · high $4.515 · low $4.44252026-06-11 · settle $4.395 · high $4.48 · low $4.3752026-06-12 · settle $4.4025 · high $4.44 · low $4.3552026-06-15 · settle $4.4175 · high $4.4375 · low $4.34252026-06-16 · settle $4.425 · high $4.4875 · low $4.392026-06-17 · settle $4.4875 · high $4.495 · low $4.41252026-06-18 · settle $4.44 · high $4.495 · low $4.41752026-06-22 · settle $4.395 · high $4.455 · low $4.392026-06-23 · settle $4.3725 · high $4.425 · low $4.352026-06-24 · settle $4.3475 · high $4.40 · low $4.3352026-06-25 · settle $4.43 · high $4.445 · low $4.3152026-06-26 · settle $4.415 · high $4.4625 · low $4.39752026-06-29 · settle $4.30 · high $4.41 · low $4.27252026-06-30 · settle $4.36 · high $4.425 · low $4.25752026-07-01 · settle $4.4225 · high $4.44 · low $4.3552026-07-02 · settle $4.415 · high $4.46 · low $4.4052026-07-06 · settle $4.5775 · high $4.5875 · low $4.4452026-07-07 · settle $4.6425 · high $4.6475 · low $4.552026-07-08 · settle $4.5625 · high $4.6575 · low $4.5452026-07-09 · settle $4.52 · high $4.555 · low $4.492026-07-10 · settle $4.61 · high $4.62 · low $4.4752026-07-13 · settle $4.6325 · high $4.695 · low $4.62252026-07-14 · settle $4.605 · high $4.6225 · low $4.56752026-07-15 · settle $4.695 · high $4.71 · low $4.58752026-07-16 · settle $4.64 · high $4.7425 · low $4.632026-07-17 · settle $4.675 · high $4.6825 · low $4.58752026-07-20 · settle $4.73 · high $4.76 · low $4.702026-07-21 · settle $4.7525 · high $4.765 · low $4.692026-07-22 · settle $4.8475 · high $4.865 · low $4.74752026-07-23 · settle $4.875 · high $4.9025 · low $4.832026-07-24 · settle $4.875 · high $4.92 · low $4.79252026-07-27 · settle $4.74 · high $4.85 · low $4.71252026-07-28 · settle $4.805 · high $4.8425 · low $4.7352026-07-29 · settle $4.7175 · high $4.835 · low $4.70752026-07-30 · settle $4.685 · high $4.755 · low $4.682026-07-31 · settle $4.64 · high $4.70 · low $4.612026-08-03 · settle $4.725 · high $4.735 · low $4.58252026-08-04 · settle $4.655 · high $4.7525 · low $4.642026-08-05 · settle $4.60 · high $4.6625 · low $4.5852026-08-06 · settle $4.62 · high $4.63 · low $4.57252026-08-07 · settle $4.62 · high $4.6725 · low $4.61252026-08-10 · settle $4.6175 · high $4.655 · low $4.5975$4.30$4.30$4.875$4.875$4.6175$4.6175DAILY HEAT STRESS — °C·DAYS ABOVE 29°C, PRODUCTION-WEIGHTED2026-05-14 · 0.1 °C·d · ERA5 observed2026-05-15 · 1.1 °C·d · ERA5 observed2026-05-16 · 0.3 °C·d · ERA5 observed2026-05-17 · 0.2 °C·d · ERA5 observed2026-05-18 · 0.1 °C·d · ERA5 observed2026-05-25 · 0.8 °C·d · ERA5 observed2026-05-26 · 0.8 °C·d · ERA5 observed2026-05-27 · 0.7 °C·d · ERA5 observed2026-05-28 · 0.7 °C·d · ERA5 observed2026-05-29 · 0.1 °C·d · ERA5 observed2026-06-01 · 0.2 °C·d · ERA5 observed2026-06-03 · 0.1 °C·d · ERA5 observed2026-06-04 · 0.1 °C·d · ERA5 observed2026-06-05 · 0.3 °C·d · ERA5 observed2026-06-06 · 1.1 °C·d · ERA5 observed2026-06-07 · 0.3 °C·d · ERA5 observed2026-06-08 · 0.3 °C·d · ERA5 observed2026-06-09 · 2.1 °C·d · ERA5 observed2026-06-10 · 1.9 °C·d · ERA5 observed2026-06-11 · 0.3 °C·d · ERA5 observed2026-06-12 · 0.1 °C·d · ERA5 observed2026-06-13 · 0.1 °C·d · ERA5 observed2026-06-17 · 0.3 °C·d · ERA5 observed2026-06-25 · 0.1 °C·d · ERA5 observed2026-06-28 · 2.0 °C·d · ERA5 observed2026-06-29 · 3.3 °C·d · ERA5 observed2026-06-30 · 2.8 °C·d · ERA5 observed2026-07-01 · 2.0 °C·d · ERA5 observed2026-07-02 · 2.0 °C·d · ERA5 observed2026-07-03 · 1.5 °C·d · ERA5 observed2026-07-04 · 0.5 °C·d · ERA5 observed2026-07-05 · 0.6 °C·d · ERA5 observed2026-07-06 · 0.9 °C·d · ERA5 observed2026-07-07 · 1.2 °C·d · ERA5 observed2026-07-08 · 1.4 °C·d · ERA5 observed2026-07-09 · 0.7 °C·d · ERA5 observed2026-07-10 · 0.4 °C·d · ERA5 observed2026-07-11 · 1.0 °C·d · ERA5 observed2026-07-12 · 1.2 °C·d · ERA5 observed2026-07-13 · 1.7 °C·d · ERA5 observed2026-07-14 · 2.7 °C·d · ERA5 observed2026-07-15 · 2.6 °C·d · ERA5 observed2026-07-16 · 2.7 °C·d · ERA5 observed2026-07-17 · 2.7 °C·d · ERA5 observed2026-07-18 · 2.4 °C·d · ERA5 observed2026-07-19 · 1.8 °C·d · ERA5 observed2026-07-20 · 3.4 °C·d · ERA5 observed2026-07-21 · 0.6 °C·d · ERA5 observed2026-07-24 · 0.1 °C·d · ERA5 observed2026-07-25 · 2.8 °C·d · ERA5 observed2026-07-26 · 4.8 °C·d · ERA5 observed2026-07-27 · 4.7 °C·d · ERA5 observed2026-07-28 · 1.9 °C·d · ERA5 observed2026-07-29 · 1.1 °C·d · ERA5 observed2026-07-30 · 0.5 °C·d · ERA5 observed2026-07-31 · 0.1 °C·d · ERA5 observed2026-08-01 · 0.1 °C·d · ERA5 observed2026-08-02 · 0.8 °C·d · ERA5 observed2026-08-03 · 1.1 °C·d · ERA5 observed2026-08-04 · 0.2 °C·d · ERA5 observed2026-08-06 · 0.2 °C·d · ERA5 observed2026-08-07 · 0.6 °C·d · ERA5 observed2026-08-08 · 0.6 °C·d · ERA5 observed2026-08-09 · 1.7 °C·d · ERA5 observed2026-08-10 · 1.9 °C·d · ERA5 observed2026-08-11 · 2.2 °C·d · ERA5 observed2026-08-12 · 3.7 °C·d · forecast · week 12026-08-13 · 2.5 °C·d · forecast · week 12026-08-14 · 3.2 °C·d · forecast · week 12026-08-15 · 4.9 °C·d · forecast · week 12026-08-16 · 1.3 °C·d · forecast · week 12026-08-17 · 0.9 °C·d · forecast · week 12026-08-18 · 2.0 °C·d · forecast · week 12026-08-19 · 3.3 °C·d · forecast · week 2, lower skill2026-08-20 · 7.0 °C·d · forecast · week 2, lower skill2026-08-21 · 5.1 °C·d · forecast · week 2, lower skill2026-08-22 · 0.2 °C·d · forecast · week 2, lower skill2026-08-24 · 0.1 °C·d · forecast · week 2, lower skill2468HOTTEST OBSERVED DAY (4.8)WEEK 2 · LOWER SKILLMAYJUNJULAUGJULY · 50.0 °C·d IN 31 DAYS34.1 IN 13-13.5¢ ON JULY 27the rally’s worst session —on its second-hottest day
One timeline, two panels, one shared axis. The market topped on July 23 and then gave back most of the premium — including its single worst session on July 27, one of the two hottest days of the season on the ground. It was pricing the forecast, not the thermometer, and the forecast window ahead of it runs at 2.62 °C·days a day against July’s 1.61 — about 1.6× the pace, over a stretch less than half as long. Price: every daily settlement, CBOT. Stress: ERA5 reanalysis through August 11, forecast after — week-two bars are faded because their skill is lower, and no single forecast day is offered as a reading.

The two panels together do something a single number cannot. The market made its high on July 23, a session on which this grid recorded 0.0 °C·days of heat stress — none at all. Its worst session of the whole rally came on July 27, down 13.5 cents — and July 27 was the second-hottest day of the entire summer on the ground, the day after the hottest (July 26, at 4.8 °C·days). The market rose on days without heat and fell hardest on a day of extreme heat, because on that day the forecast had turned wet. It was never trading the thermometer. It was trading the next two weeks.

Then the rain arrived, the premium drained, and the forecast reloaded.

The window ahead runs hotter per day than July did

Across the same grid, the forecast for August 12 through 24 runs at 2.62 °C·days a day against July’s 1.61 — about 1.6 times the daily pace, over a window 13 days long rather than thirty-one. In totals that is 34.1 °C·days ahead against 50.0 banked in July. Rainfall over the same window comes in -32 mm short of what the crop will transpire.

Watch that forecast total rather than trusting it. On this morning’s 03:16 model run the same thirteen days came to 54.1 °C·days; by 11:13 they came to 34.1. Twenty degree-days left the outlook in eight hours, almost all of them from August 22 to 24 — the back of the window, where skill is thinnest. The daily pace barely moved, which is why it is the comparison quoted here. A number that can shed a third of itself before noon is exactly the kind of number a monthly report cannot hold, and exactly the kind a decision this week has to be made against.

NOAA’s Climate Prediction Center describes the same pattern independently: above-normal temperatures across the entire Corn Belt under a subtropical ridge, with the greatest departures over the Plains, for the periods valid August 16 through 24. The pattern is corroborated. The precise magnitudes in week two are not, and we treat them accordingly.

HEAT STRESS BANKED — 31 DAYS OF JULY vs THE NEXT 13 (°C·days >29°C)Production-weighted. The forecast bars cover fewer than half as many days.4080120US corn belt · July 1–31 observed · 50.0 °C·days50US corn belt · Aug 12–24 forecast · 34.1 °C·days34US corn beltIowa · July 1–31 observed · 43.7 °C·days44Iowa · Aug 12–24 forecast · 31.9 °C·days32IowaEast · July 1–31 observed · 34.5 °C·days34East · Aug 12–24 forecast · 25.4 °C·days25EastNorthwest · July 1–31 observed · 46.3 °C·days46Northwest · Aug 12–24 forecast · 23.5 °C·days24NorthwestPlains · July 1–31 observed · 85.6 °C·days86Plains · Aug 12–24 forecast · 74.2 °C·days74PlainsJuly 1–31, observed (31 days)Aug 12–24, forecast (13 days)
Every region is forecast a lighter total than July delivered — over fewer than half as many days. That is the comparison to watch: the forecast bars cover 13 days against July’s 31, so a similar bar is a far heavier daily load. Plains carries the largest forecast total. Iowa, which holds the national condition number up, is forecast less than it absorbed in all of July — a regional average can still move opposite to the acres that matter most inside it.

Iowa is the number that matters. Rated 82% good-to-excellent, it is the single strongest major state and the pillar holding the national average up through a mediocre summer. It is forecast 31.9 °C·days over the next thirteen days — against 43.7 across all thirty-one days of July, so a heavier daily load on the state carrying the national number — with rainfall running -37 mm behind demand. The Plains — already -208 mm in deficit for the season — are forecast 74.2.

Note what the chart above does to the northwestern belt: 23.5 °C·days forecast against 46.3 in July, an average pulled down by Minnesota and the Dakotas while Iowa, the largest producer inside that same region, carries 31.9. A regional average can sit well below the acres that matter most inside it — which is a good argument for resolving weather to the field rather than to the state, and a better one for weighting by production rather than by area.

Heat stress and water balance by region — the figures behind the three charts above
Region July stress Next 13d stress Aug 1–11 balance Next 13d balance
US corn belt 50.0 34.1 +1 -32
Iowa 43.7 31.9 +16 -37
East — IL·IN·OH·MO·KY·MI 34.5 25.4 +32 -20
Northwest — IA·MN·WI·SD·ND 46.3 23.5 -8 -37
Plains — NE·KS 85.6 74.2 -32 -44

The August rain was real. It fell on the wrong acres.

Between August 1 and 11, the eastern Corn Belt banked a genuine surplus of +32 mm — rain in excess of what the crop used. That is the rain the market repriced on, and in Indiana, where the cells average +65 mm, it was a real rescue. The northwestern belt came in at -8 mm, roughly break-even. The Plains, the region that needed it most, got the least: -32 mm.

WATER BALANCE — RAINFALL MINUS CROP WATER DEMAND (mm)Production-weighted. Right of the line = surplus. Left = the crop drew down soil moisture.EASTIL·IN·OH·MO·KY·MIAUG 1–11 · THEN AUG 12–24East — IL·IN·OH·MO·KY·MI · Aug 1–11 · observed · +32.3 mm+32East — IL·IN·OH·MO·KY·MI · Aug 12–24 · forecast · -19.5 mm-20NORTHWESTIA·MN·WI·SD·NDAUG 1–11 · THEN AUG 12–24Northwest — IA·MN·WI·SD·ND · Aug 1–11 · observed · -7.8 mm-8Northwest — IA·MN·WI·SD·ND · Aug 12–24 · forecast · -37.2 mm-37PLAINSNE·KSAUG 1–11 · THEN AUG 12–24Plains — NE·KS · Aug 1–11 · observed · -31.7 mm-32Plains — NE·KS · Aug 12–24 · forecast · -43.7 mm-440 — break-evenobserved (ERA5)forecast
The early-August rain was real — and it fell on the wrong acres. The East banked a genuine surplus. The Northwest roughly broke even. The Plains, already the driest region of the season, got the least. Every region turns negative in the forecast window.

Regions are a convenience, though. The grid underneath is sixty cells, and at that resolution the pattern is a gradient rather than three blocks — running from 103 °C·days across the Kansas cells and 80 across Missouri’s down to 4 in Wisconsin. What matters is not where the gradient is steepest but what sits in the middle of it: Nebraska and Iowa, which together carry 13% and 20% of this grid’s production.

WHAT AUG 1–11 DELIVEREDwater balance, mmND (47, -99) · -39.4 mm · 0.6% of belt productionND (47, -98) · -41.8 mm · 0.6% of belt productionND (47, -97) · -50.0 mm · 0.6% of belt productionND (47, -96) · -1.3 mm · 0.6% of belt productionND (46, -98) · -55.2 mm · 0.6% of belt productionND (46, -97) · -40.1 mm · 0.6% of belt productionSD (45, -98) · -53.6 mm · 1.0% of belt productionSD (45, -97) · -46.5 mm · 1.0% of belt productionMN (45, -95) · -32.1 mm · 1.3% of belt productionMN (45, -94) · -38.4 mm · 1.3% of belt productionSD (44, -99) · -59.1 mm · 1.0% of belt productionSD (44, -98) · -49.9 mm · 1.0% of belt productionSD (44, -97) · -37.9 mm · 1.0% of belt productionMN (44, -96) · -37.1 mm · 1.3% of belt productionMN (44, -95) · -27.3 mm · 1.3% of belt productionMN (44, -94) · -27.8 mm · 1.3% of belt productionMN (44, -93) · -13.8 mm · 1.3% of belt productionWI (44, -90) · -21.8 mm · 1.0% of belt productionWI (44, -89) · -20.4 mm · 1.0% of belt productionSD (43, -98) · -27.0 mm · 1.0% of belt productionSD (43, -97) · -3.4 mm · 1.0% of belt productionMN (43, -95) · -13.7 mm · 1.3% of belt productionMN (43, -94) · +5.8 mm · 1.3% of belt productionIA (43, -93) · +7.3 mm · 2.9% of belt productionWI (43, -90) · -0.2 mm · 1.0% of belt productionWI (43, -89) · +19.7 mm · 1.0% of belt productionNE (42, -98) · -25.8 mm · 2.6% of belt productionNE (42, -97) · -19.0 mm · 2.6% of belt productionIA (42, -95) · +2.2 mm · 2.9% of belt productionIA (42, -94) · +31.1 mm · 2.9% of belt productionIA (42, -93) · +17.2 mm · 2.9% of belt productionIA (42, -92) · +18.9 mm · 2.9% of belt productionNE (41, -99) · -43.1 mm · 2.6% of belt productionNE (41, -98) · -45.9 mm · 2.6% of belt productionNE (41, -97) · -10.8 mm · 2.6% of belt productionIA (41, -94) · -5.9 mm · 2.9% of belt productionIA (41, -93) · +44.5 mm · 2.9% of belt productionIL (41, -89) · +39.8 mm · 3.6% of belt productionIN (41, -87) · +36.0 mm · 1.6% of belt productionIN (41, -86) · +39.2 mm · 1.6% of belt productionOH (41, -85) · +51.5 mm · 0.8% of belt productionOH (41, -84) · +29.8 mm · 0.8% of belt productionOH (41, -83) · +18.3 mm · 0.8% of belt productionKS (40, -98) · -47.3 mm · 1.6% of belt productionKS (40, -97) · -27.2 mm · 1.6% of belt productionMO (40, -93) · +5.4 mm · 1.0% of belt productionMO (40, -92) · +0.2 mm · 1.0% of belt productionIL (40, -90) · +7.3 mm · 3.6% of belt productionIL (40, -89) · +24.8 mm · 3.6% of belt productionIL (40, -88) · +49.4 mm · 3.6% of belt productionIN (40, -87) · +120.7 mm · 1.6% of belt productionIN (40, -86) · +67.6 mm · 1.6% of belt productionIN (40, -85) · +60.2 mm · 1.6% of belt productionOH (40, -84) · +25.8 mm · 0.8% of belt productionOH (40, -83) · +33.1 mm · 0.8% of belt productionKS (39, -98) · -31.4 mm · 1.6% of belt productionKS (39, -97) · -43.1 mm · 1.6% of belt productionMO (39, -93) · -2.1 mm · 1.0% of belt productionMO (39, -92) · -8.4 mm · 1.0% of belt productionIL (39, -89) · +9.6 mm · 3.6% of belt productionNDSDMNWIIANEILINOHKSMO−65−45−25−100+10+40+80+120drier ← → wetter than the crop usedWHAT AUG 12–24 IS FORECASTheat stress, °C·daysND (47, -99) · +9.0 °C·days · 0.6% of belt productionND (47, -98) · +5.3 °C·days · 0.6% of belt productionND (47, -97) · +7.8 °C·days · 0.6% of belt productionND (47, -96) · +2.8 °C·days · 0.6% of belt productionND (46, -98) · +6.2 °C·days · 0.6% of belt productionND (46, -97) · +6.0 °C·days · 0.6% of belt productionSD (45, -98) · +13.1 °C·days · 1.0% of belt productionSD (45, -97) · +4.0 °C·days · 1.0% of belt productionMN (45, -95) · +8.1 °C·days · 1.3% of belt productionMN (45, -94) · +9.6 °C·days · 1.3% of belt productionSD (44, -99) · +34.6 °C·days · 1.0% of belt productionSD (44, -98) · +33.9 °C·days · 1.0% of belt productionSD (44, -97) · +30.9 °C·days · 1.0% of belt productionMN (44, -96) · +22.2 °C·days · 1.3% of belt productionMN (44, -95) · +23.0 °C·days · 1.3% of belt productionMN (44, -94) · +16.0 °C·days · 1.3% of belt productionMN (44, -93) · +3.8 °C·days · 1.3% of belt productionWI (44, -90) · +6.0 °C·days · 1.0% of belt productionWI (44, -89) · +1.8 °C·days · 1.0% of belt productionSD (43, -98) · +33.3 °C·days · 1.0% of belt productionSD (43, -97) · +49.1 °C·days · 1.0% of belt productionMN (43, -95) · +32.4 °C·days · 1.3% of belt productionMN (43, -94) · +26.0 °C·days · 1.3% of belt productionIA (43, -93) · +13.2 °C·days · 2.9% of belt productionWI (43, -90) · +5.6 °C·days · 1.0% of belt productionWI (43, -89) · +3.8 °C·days · 1.0% of belt productionNE (42, -98) · +35.5 °C·days · 2.6% of belt productionNE (42, -97) · +57.2 °C·days · 2.6% of belt productionIA (42, -95) · +45.1 °C·days · 2.9% of belt productionIA (42, -94) · +33.4 °C·days · 2.9% of belt productionIA (42, -93) · +22.4 °C·days · 2.9% of belt productionIA (42, -92) · +17.3 °C·days · 2.9% of belt productionNE (41, -99) · +62.6 °C·days · 2.6% of belt productionNE (41, -98) · +69.5 °C·days · 2.6% of belt productionNE (41, -97) · +73.7 °C·days · 2.6% of belt productionIA (41, -94) · +42.3 °C·days · 2.9% of belt productionIA (41, -93) · +49.3 °C·days · 2.9% of belt productionIL (41, -89) · +12.8 °C·days · 3.6% of belt productionIN (41, -87) · +3.2 °C·days · 1.6% of belt productionIN (41, -86) · +0.5 °C·days · 1.6% of belt productionOH (41, -85) · +0.4 °C·days · 0.8% of belt productionOH (41, -84) · +3.3 °C·days · 0.8% of belt productionOH (41, -83) · +1.2 °C·days · 0.8% of belt productionKS (40, -98) · +94.5 °C·days · 1.6% of belt productionKS (40, -97) · +93.4 °C·days · 1.6% of belt productionMO (40, -93) · +86.4 °C·days · 1.0% of belt productionMO (40, -92) · +71.0 °C·days · 1.0% of belt productionIL (40, -90) · +47.1 °C·days · 3.6% of belt productionIL (40, -89) · +23.4 °C·days · 3.6% of belt productionIL (40, -88) · +10.8 °C·days · 3.6% of belt productionIN (40, -87) · +3.8 °C·days · 1.6% of belt productionIN (40, -86) · +4.0 °C·days · 1.6% of belt productionIN (40, -85) · +1.5 °C·days · 1.6% of belt productionOH (40, -84) · +3.4 °C·days · 0.8% of belt productionOH (40, -83) · +10.0 °C·days · 0.8% of belt productionKS (39, -98) · +115.7 °C·days · 1.6% of belt productionKS (39, -97) · +108.3 °C·days · 1.6% of belt productionMO (39, -93) · +87.6 °C·days · 1.0% of belt productionMO (39, -92) · +75.4 °C·days · 1.0% of belt productionIL (39, -89) · +43.6 °C·days · 3.6% of belt productionNDSDMNWIIANEILINOHKSMO<1515356090130+cooler ← → hotterEach hexagon is one grid cell; its size is that cell’s share of belt production — bigger hex, more bushels at stake.
The same sixty cells, twice. On the left, the early-August rain: Indiana and Ohio banked real surpluses while the Dakotas, Nebraska and Kansas kept drawing down. On the right, the forecast, and the gradient runs southwest to northeast — KS averages 103 °C·days across its cells and MO 80, against 3 for IN. Hexagon size is production share, which is why the cells worth watching are Nebraska’s and Iowa’s: they hold 13% and 20% of the belt’s production and sit in the middle of that gradient, not at its cool end.

A national average of one number can be built from three regions telling three different stories. The rating tape shows the same thing in a different register: 12% of the crop was rated poor or very poor in late July, against 7% a year earlier — while Iowa held above eighty percent good-to-excellent.

US CORN RATED GOOD-TO-EXCELLENT (%)USDA NASS weekly prints. Each dot describes the week that had already ended.606570w/e 7/19 · 67% good-to-excellent67w/e 7/19w/e 7/26 · 63% good-to-excellent63w/e 7/26w/e 8/02 · 61% good-to-excellent61w/e 8/02w/e 8/09 · 61% good-to-excellent61w/e 8/09−6 pointsin four weeks,each print aweek behind.
The rating fell after the heat, not during it. Twelve percent of the crop was rated poor or very poor in late July against seven percent a year earlier — a reading published once the damage was already in the field.

What that gap is worth at a real decision

Not a trade — a pricing decision, the one every grower faces every August. A farmer who priced new-crop bushels at the July 23 settlement rather than at August 10’s captured $47.12 per acre more, on USDA’s own 183.0 bu/ac yield. Nobody rings a bell at the top, and hindsight is not a strategy. But the same decision is live today, and it turns on the same input: price before the ridge and the reports resolve, or after.

That is the shape of weather value in agriculture. It is not the forecast itself. It is the interval between when a condition becomes knowable and when the institutions get to say so — and who is holding a defensible view during it.

What we will not claim

We keep a dated, frozen prediction ledger for this crop, appended once and never revised. Two rows from early July are on the record, and they read as follows.

From the ledger — banked, dated, unrevised

July 1, 2026176.4 bu/ac6.6 bushels below the USDA figure, banked the session after December corn printed its contract low.
July 7, 2026176.1 bu/ac6.9 bushels below, banked twenty days before the print that first showed the crop losing condition.

The direction was right and it was frozen in advance. The magnitude is not calibrated — this model has never been scored against a harvest, and the first honest scoring comes in January 2027. We are not going to dress a cold start as a track record.

Two further disclosures. Our ledger then banked nothing between July 7 and August 11, which means we hold no receipt for the July top or the August break — the instrument that argues cadence is the edge missed its own cadence, and saying so is cheaper than pretending otherwise. And today’s model row carries a known stage-model defect (it reads the crop as less advanced than USDA observes it), so its yield figure is suppressed rather than published.

Method. Weather quantities are computed across 60 grid cells spanning 11 states, weighted by USDA state production share. Heat stress is the sum of daily maximum temperature above 29°C, in °C·days. Water balance is precipitation minus FAO-56 reference evapotranspiration, in millimetres. Observations through August 11 are ERA5 reanalysis; August 12 onward is a forecast model, drawn distinctly in every chart. Week-two forecast magnitudes carry materially lower skill than week one; the pattern is corroborated by CPC, the magnitudes are not.

Correction, made in the course of this analysis. An earlier internal note described USDA as having cut its corn yield to 183.0 bu/ac in July. It did not. That figure has been carried unchanged since the May estimate; 186.5 was the 2025 final yield, and we had it mis-filed as the current consensus. The two ledger rows above are restated against the correct figure. No number in this article rests on the earlier error.

The instrument that covers the gap

Every number in this article that describes the sky — the daily stress bars, the regional water balances, the forecast window — comes from the same place: continuous atmospheric observation and forecasting, resolved to the field rather than the state, and updated daily instead of weekly. That is the work Tomorrow.io does. This particular fortnight makes an unusually clean case for it, but the case is general, and it is not really about corn.

Institutions measure carefully and publish on a schedule. Markets price continuously. Weather changes daily. Wherever those three cadences disagree, there is a window in which the only current view of the world is a forecast — and the quality of the decision made inside that window is exactly the quality of the forecast held during it.

The next report lands tomorrow. The ridge lands with it.

Sources

  1. USDA NASS, Crop Progress — the weekly releases themselves: July 20, July 27, August 3 and August 10, 2026. 18-State condition totals give the 67% → 61% good-to-excellent series and the 12% poor-to-very-poor reading for the week ending July 26; the August 10 release gives 94% silked, 61% dough and 16% dented against five-year averages of 93%, 55% and 12%.
  2. USDA World Agricultural Supply and Demand Estimates, July 2026. 2026-27 corn yield 183.0 bu/ac, unchanged from the June projection; 95.3M acres planted, 87.4M harvested; production 16.00 billion bushels. The same table carries 2025-26 at 186.5 bu/ac and 17.021 billion bushels — the record crop this one is measured against.
  3. CBOT December 2026 corn (ZCZ26), daily settlements, retrieved via the Yahoo Finance chart API. Every price figure here — the $4.30 low close on June 29, the $4.875 peak close on July 23 ($4.92 intraday on July 24), the $4.6175 settlement on August 10, and the 57.5-cent and 26-cent moves — is arithmetic on that series rather than a quotation. Delayed/derived exchange data.
  4. Agweek, “Has the 2026 corn low been printed?” The June 30 contract low and the rally off it; Randy Thompson quotation.
  5. ADM Investor Services, Ag Market View (July 23, 2026). Managed-money long position near 100,000 contracts; the $5.065 May high, which the exchange series independently confirms.
  6. Pre-report trade surveys for the August 12 WASDE, as reported across the agricultural press (Reuters’ survey average of 182.4 bu/ac; a 182.5 bu/ac yield implies a 15.950 billion bushel crop on unchanged acreage).
  7. Pro Farmer. Initial 2026 Crop Condition Index (Iowa 82% good-to-excellent) and Crop Tour dates, August 17–20.
  8. Farm Forum / “Focus on Ag” (Aug 4, 2026). US Drought Monitor conditions as of July 30, and the 7% poor-to-very-poor comparison for the same week a year earlier.
  9. NOAA Climate Prediction Center. 6–10 and 8–14 day outlook discussions valid August 16–24, 2026.
  10. ECMWF ERA5 reanalysis (via the Open-Meteo archive) and the Open-Meteo forecast model, sampled on the production-weighted grid described in the method note. FAO-56 reference evapotranspiration.
  11. Schlenker & Roberts (2009), PNAS. The nonlinear temperature threshold above which US corn yields decline sharply, the basis for the 29°C stress measure used here.

See Tomorrow.io in Action!

This site is protected by reCAPTCHA and the Google Privacy Policy and Terms of Service apply.

TOS(Required)

Sign Up for the Tomorrow.io Weather API for Free

Try Now
Summarize this article with: Summarize with: