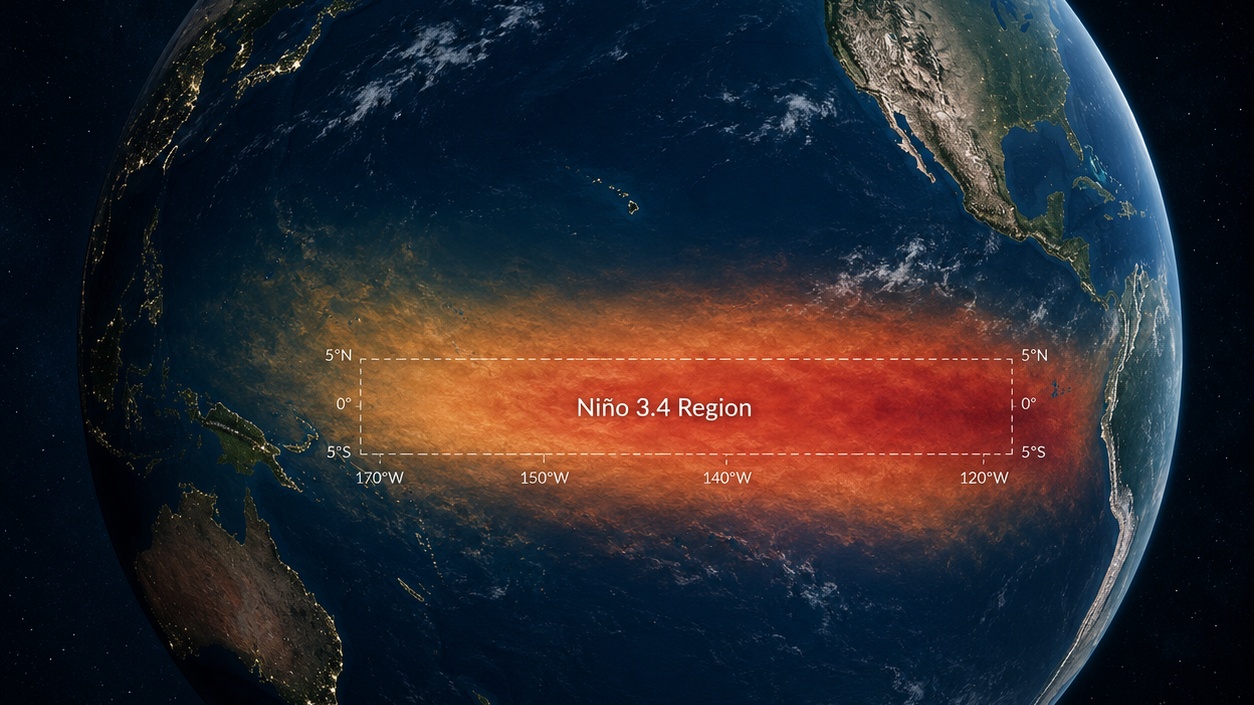
The El Niño signature: a warm tongue of equatorial Pacific water spreading east. NOAA’s Climate Prediction Center declared an El Niño Advisory on June 11, 2026 — and for the first time, the ocean was watched the whole way in.
Every few years, a patch of the equatorial Pacific warms and rearranges weather on every continent — harvests, storms, shipping lanes, heating bills. It is called El Niño, and as of this June, a new one is officially here. NOAA’s Climate Prediction Center issued its advisory on June 11. This piece explains what the data shows, and what it doesn’t.
What NOAA’s advisory says
El Niño is declared when the central Pacific holds at +0.5°C above normal for five consecutive overlapping three-month seasons. On June 11, NOAA’s Climate Prediction Center crossed that threshold and issued an official advisory.
The current reading stands at +0.7°C in the Niño-3.4 region — the key patch of equatorial Pacific between 170°W and 120°W. The easternmost pocket of the basin, Niño-1+2 off the coast of Peru, is already running at +2.1°C — a classically eastern-Pacific opening that historically drives the fishery and food-chain disruptions Peru knows well.
The probability that El Niño conditions hold through the December–February peak stands at ~99%, per CPC’s June 11 reading. The IRI multi-model plume sits at 96–98% through early 2027. The event is here; the question now is not whether, but how strong.
On strength, NOAA’s June outlook gives 63% odds the November–January peak ranks “very strong” — among the largest events on record going back to 1950. That is a lean, not a verdict. Those odds were issued near the spring predictability barrier, the time of year forecasts are shakiest. July’s reading will say whether the ocean–atmosphere coupling that drives the strongest events is holding.
NOAA’s Climate Prediction Center publishes the official ENSO status, the weekly Niño-region readings, and the seasonal probabilities — forecasts issued in advance, verification after.
How El Niño works
Steady trade winds normally blow west along the equator, pushing warm surface water toward Indonesia until it pools at around 30°C. Off South America, those same winds drag surface water away from the coast, so cold, nutrient-rich water rises to replace it. When the trade winds weaken, that warm water slides back east. As the eastern Pacific warms, the temperature contrast that powered the winds softens — so the winds ease further, which lets still more warm water move east. The meteorologist Jacob Bjerknes identified this self-reinforcing loop in 1969. The cold upwelling shuts down, and the Pacific’s center of thunderstorm activity shifts thousands of miles east.
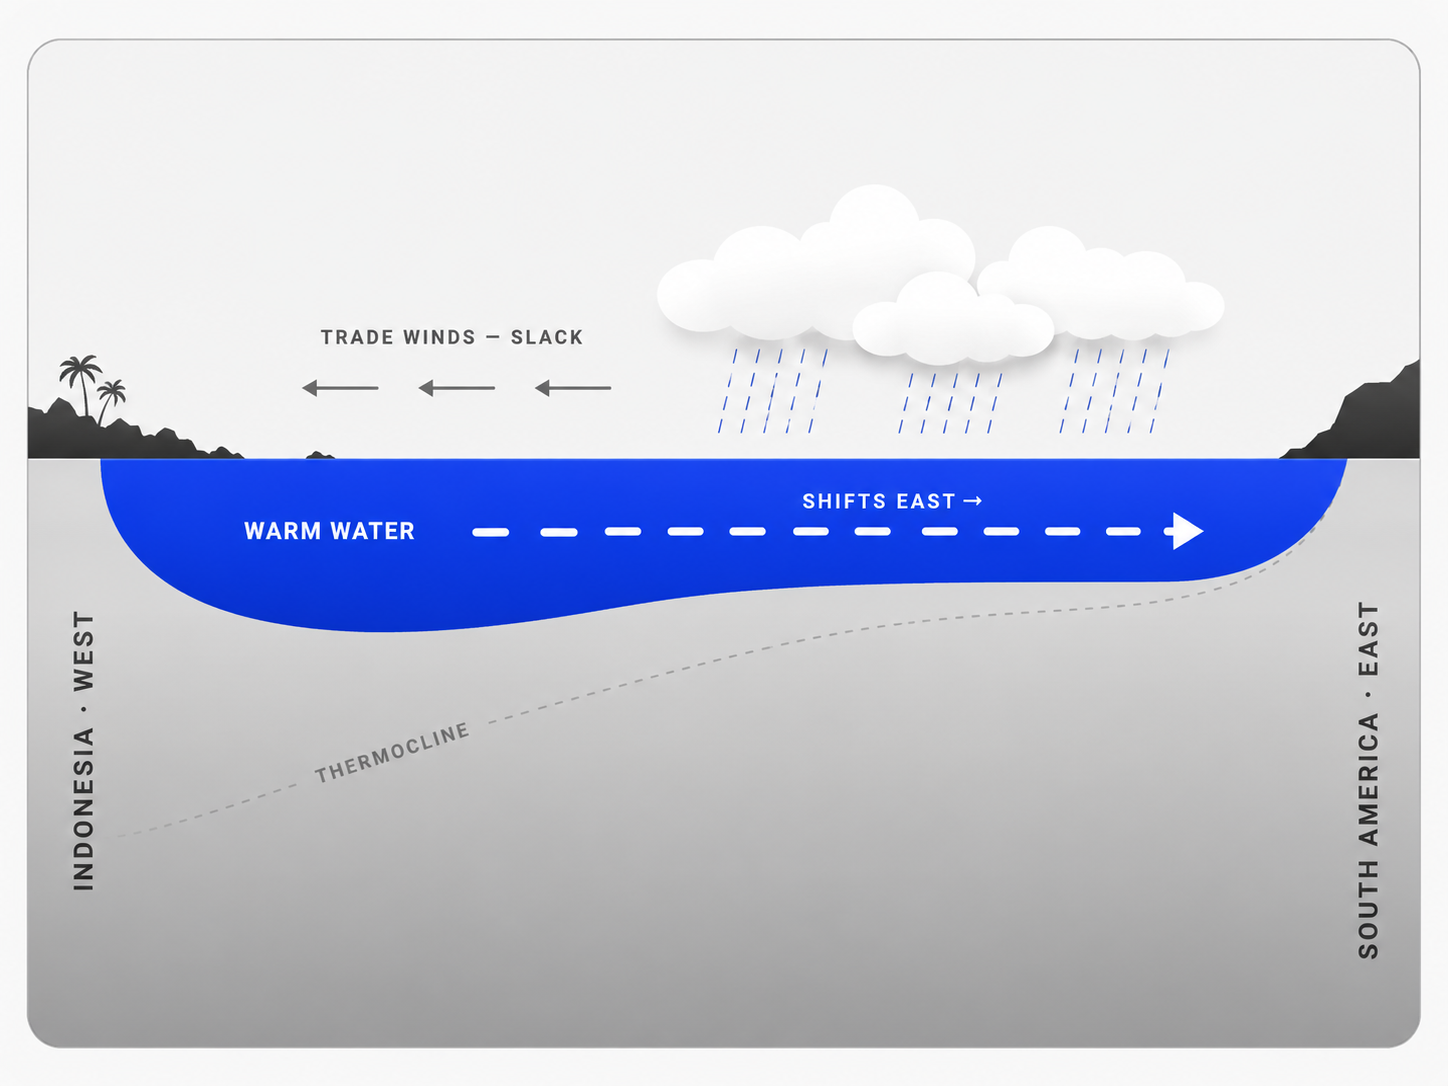
That eastward shift in storm activity is what the rest of the planet feels — in the monsoon, the hurricane basin, the jet stream over North America, and the harvests from Peru to Indonesia.
How forecasters learned to predict it
For most of the 20th century, El Niño arrived without warning. Four episodes changed that.
What El Niño typically changes, and where
When the Pacific’s storm center shifts east, it bends the jet stream — and the jet stream is what carries weather across continents.
In a typical El Niño winter, the Pacific jet stream extends toward the equator and steers storm after storm across the southern United States — wetter, cooler, stormier across the Gulf and the South — while the northern tier, left outside the storm track, runs milder and drier. Indonesia and eastern Australia tilt toward drought. India faces a weaker-than-average monsoon; IMD’s April 2026 outlook puts a 35% chance of a deficient season — more than double the climatological rate. And the Atlantic hurricane season, one of El Niño’s most reliable connections, gets wind shear that tears storms apart before they organize.
Hold the California lesson close, because it disciplines everything above. After the drenching El Niño winters of 1982–83 and 1997–98, Californians learned to expect rain from a strong event. Then the strongest El Niño in the modern record arrived in 2015–16 — and the storm track ran north, and the drought-busting rains never came.
The traditionally expected relationship has gone the other way. — Marty Ralph, UC San Diego / CW3E, after the 2015–16 winter
Every regional tendency in an El Niño season is a probability statement, not a guarantee. The grid of connections is real — the physics is settled — but each individual season plays out differently. That is not a weakness of the forecast. It is what the forecast honestly says: El Niño loads the dice. It does not deal the hand.
The economic record
El Niño does not simply cost money — it moves money. The same event takes from one region while producing savings in another, often in the same winter.
Peer-reviewed work in Science attributes $5.7 trillion in lost global income over the five years following the 1997–98 event — the burden falling hardest on the tropical countries least responsible for, and least insured against, the swings. The same winter logged a net positive for the United States: roughly $19.6 billion in mild-winter savings and record retail and construction activity, against $4 billion in direct storm losses. Not a contradiction — four different scopes measuring four different things.
In 2015–16, U.S. heating demand ran 18% below the prior winter. Propane fell 16%. Heating oil fell 18%. Meanwhile, the same El Niño-linked drought left more than 10 million Ethiopians needing food assistance — the country’s worst drought in decades — and put more than 20 million people at risk across southern Africa.
The gains are diffuse — millions of slightly smaller heating bills across a continent. The losses are concentrated — one coastline, one crop, one harvest season. The ledger is not balanced by the arithmetic; it is balanced by geography. Advance warning is the one thing that can shift that balance.
The soil has no use without water. — Abdi Gire Wais, farmer, Fadeto displacement centre, Ethiopia, 2016. He arrived with 15 cattle and 100 sheep and goats; three months later, two cattle and twenty remained.
What we still don’t know
How strong this El Niño becomes is not yet settled. NOAA puts 63% odds on a “very strong” November–January peak — one of the largest events since 1950 — based on its RONI-calibrated outlook. But those odds were issued near what forecasters call the spring predictability barrier, the time of year when the Pacific is often mid-transition and forecasts are least reliable. July’s reading will show whether the ocean–atmosphere coupling that drives the strongest events is holding.
Even if it does reach very strong intensity, that doesn’t guarantee regional impacts. The strongest El Niño in the modern record, 2015–16, left California dry when the storm track ran north. The regional tendencies described above are historical likelihoods, not certainties. Any highly confident regional headline issued before December should be read with that in mind.
NOAA updates the El Niño diagnostic every second Thursday. The next reading is July 9.
El Niño forecasting in itself has no intrinsic value. What value it has is how people react to it. — G.O.P. Obasi, WMO Secretary-General, 2000
I remember 1984 — people would migrate or just die. This time, the government response is on time and coming before people leave. — Mohammed Abdullah, farmer, East Hararghe, Ethiopia, speaking during the 2015–16 drought, to the Washington Post
Earth observation made this possible
The story of El Niño prediction is, at its core, a story about instruments.
When the 1972 event blindsided Peru’s fishermen and the 1982 event went unseen for months, the gap wasn’t in the equations — Bjerknes had described the mechanism more than a decade earlier. The gap was in the observation record. There was no continuous, dense, real-time signal from the equatorial Pacific. What changed everything was hardware: the TAO array of moored buoys strung across the Pacific, satellites reading sea-surface height and temperature from orbit, Argo floats profiling the water column from the inside. Together they turned a phenomenon that had been hidden in the ocean into a readable, trackable signal — one that is now called months in advance.
This is what earth observation does at its best. It doesn’t invent patterns that weren’t there. It makes visible the ones that were always happening, but that we lacked the instruments to see. A half-degree anomaly in a patch of the equatorial Pacific had consequences for harvests, shipping lanes, hurricane seasons, and energy grids on every continent — for thousands of years before anyone could measure it. The signal existed. What changed was our capacity to receive it. That capacity was built instrument by instrument, observation by observation, over fifty years. The result is one of the most consequential improvements in forecasting that civilization has produced.
The atmosphere still holds the same kind of underobserved patterns — at vertical layers, temporal frequencies, and spatial scales that current networks don’t fully cover. Tomorrow.io’s mission is to close that gap: to build and proliferate more earth observation instruments that measure the atmosphere at higher frequency and finer resolution, generating the continuous, dense signal record that turns an undetected pattern into a forecast with lead time. The same logic that wired the Pacific, applied to the full atmospheric column — learning the planet’s weather and climate patterns at a scale that has never been done before. Because the next consequential signal is already out there. We just haven’t built the instruments to read it yet.
Sources
- NOAA CPC, ENSO Diagnostic Discussion — June 11, 2026. El Niño Advisory; weekly Niño-3.4 +0.7°C & Niño-1+2 +2.1°C; seasonal probabilities; RONI-based strength odds.
- IRI/CCSR probabilistic ENSO plume — mid-May 2026. P(El Niño) 96–98% through early 2027.
- WMO El Niño/La Niña Update, May 2026. Model agreement; spring predictability barrier.
- NOAA CPC, Relative ONI (RONI). L’Heureux et al. 2024; official ENSO strength index.
- Bjerknes, J. (1969), “Atmospheric teleconnections from the equatorial Pacific,” Monthly Weather Review 97:163–172.
- Callahan & Mankin (2023),Science, DOI 10.1126/science.adf2983. $4.1T (1982–83) and $5.7T (1997–98) five-year global income losses.
- Changnon, S. (1999),BAMS 80(9):1819–1827. 1997–98 U.S.: ~$4B direct losses vs ~$19.6B benefits.
- Pielke & Landsea (1999),BAMS 80(10):2027–2033. P(≥$1bn U.S. hurricane damage): 0.32 El Niño / 0.77 La Niña.
- TAO array history: McPhaden (NOAA/PMEL); Tollefson, Nature 2014. Buoy network inception, 2012–14 data-return collapse, 2023–27 refresh.
- 2015–16 East/Southern Africa: UN/FAO, Oxfam, Washington Post. 10.2M Ethiopians food-insecure; >20M at risk across southern Africa.
- NOAA 2026 Atlantic hurricane outlook (May 21, 2026). Below-normal — 8–14 named storms; El Niño-enhanced shear cited.
- G.O.P. Obasi, WMO Secretary-General, 2000: “El Niño forecasting in itself has no intrinsic value. What value it has is how people react to it.”
- Ralph, M. (UC San Diego / CW3E), LA Times, post-2015–16: expected El Niño–California wetness relationship “has gone the other way” since 2000.