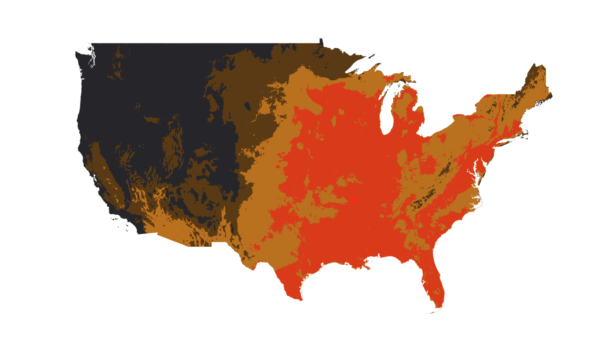

Every day of the year, scored. The thin lines are single years; the bold line is what survives when you stop asking about one date and start asking about a fortnight.
When we launched the Beautiful Day Index, we said we would come back and tell you which days of the year are consistently the best. Here is that answer. The country’s finest stretch runs from September 24 to October 11, peaking on October 3, when roughly 72% of the United States is having a beautiful day. The more interesting result is the one we did not expect: we can tell you the fortnight with confidence, and we cannot tell you the day.
What counts as a beautiful day
The index scores every hour on five things people actually notice — how mild it is, how dry, how calm, how bright, and whether it rained. A location gets a beautiful day when the average of its daylight hours, 9am to 7pm local, clears 74 on a 0–100 scale. Nights do not vote. A beautiful day is a daytime experience.
The national number is the share of the country’s land area having one, weighted by the actual size of each place rather than by how many people live there. It answers “how much of America is beautiful today,” not “how many Americans are comfortable today.” Those are different questions and this piece only answers the first.
Autumn wins, and it is not close
September is the best month in the country at 62.8%, with October just behind at 59.6%. Nothing else comes near. May is third at 53.2%, and after that the year falls away quickly.
The surprise is where summer lands. July, at 32.9%, is a worse month for beautiful weather than April. June is worse than April too. The months people plan their lives around are not the months the atmosphere is at its best — humidity, afternoon storms and heat push high summer into a trough that sits below the spring on either side of it. The year has two crests, one in May and a much bigger one from September into October, with a dip between them where the calendar says summer.
Why we will not name a single day
The obvious way to finish this piece would be to crown one date. The data offers a candidate: October 9 has the highest two-year average of any calendar day, at 82.6%. We are not going to print that as the answer, because when we checked whether it repeats, it does not.
Compare the two years on the same calendar date and they disagree by 12.2 percentage points on average. September 27 was a 68% day in 2024 and an 88% day in 2025 — the same date, twenty points apart. Across all 365 dates the correlation between the two years is 0.71, which sounds respectable until you realise it is describing whether a specific date is reliably good, and the answer is that it is not.
Widen the question from a date to a fortnight and the disagreement mostly dissolves. The two years agree at 0.93 on the shape of the season. This is not a defect in the measurement. It is the actual structure of weather: the season is a real, stable, predictable thing, and the individual day inside it is a coin flip that the season has weighted in your favour. The honest unit of an answer about the calendar is a window.
So we widened it, and then we checked it against a longer record. A separate pull — ten years, 2016 through 2025, on an independent coarse grid that shares none of its years with the main dataset beyond the last two — puts the peak of the American year on October 2. The two-year, higher-resolution record puts it on October 3. Two different samples, eight extra years, one day apart.
What the shape is good for
If you are choosing a fortnight for something that the weather can ruin — an outdoor wedding, a long ride, a fortnight of leave you only get once — the last week of September and the first ten days of October are, measurably, the best bet in the American calendar. That is a real edge and it is worth having.
What the same data says just as clearly is that the edge is a distribution, not a promise. October 3 is the best bet of the year and it was still an ordinary day somewhere. This is the whole reason forecasting is done in probabilities rather than pronouncements: the useful claim is almost never “this day will be beautiful,” it is “here is how the odds are stacked, and here is how confident that stacking is.” A climatology tells you where to stand. A forecast tells you what is coming. Neither one gets to skip the uncertainty, and the ones that pretend to are the ones that let you down.
The index behind these numbers is the same one that scores the map for today and tomorrow. Same formula, same threshold, same definition of a beautiful day — pointed at a decade of the past instead of the week ahead. That it produces a coherent seasonal shape from two independent samples is the only evidence we have that the scoring means anything at all.
Sources
- ERA5 reanalysis (ECMWF / Copernicus Climate Change Service). Hourly 2 m temperature, dew point, cloud cover, 10 m wind speed and gusts, and precipitation, accessed through the Open-Meteo Historical Weather API. Two records were used: a 55-point CONUS land grid over 2024–2025 (731 days) for the national curve and every percentage quoted here, and an independent 14-point grid over 2016–2025 (3,653 days) used only to check where the seasonal peak falls.
- Beautiful Day Index definition (Tomorrow.io). A beautiful day is a daytime mean — 9am to 7pm local — of 74 or higher on the 0–100 index, which scores mildness, dryness, calm, brightness and the absence of rain. National figures are land-area weighted by the cosine of latitude.
- Replication test. Pearson correlation and mean absolute difference between the 2024 and 2025 curves on matched calendar dates (r = 0.71, 12.2 points), and between the same two curves after a 15-day circular moving average (r = 0.93, 5.3 points). Feb 29 excluded.
- Scope. Continental United States land points only. Figures describe the share of land area, not of population, and the percentages quoted come from the two-year record; the ten-year record is cited only for the position of the peak, not for any level.
▽