The whole question of the Fourth, in one frame: the show is firing — but will the sky let the crowd see it?
Most people check one number before a fireworks show: the chance of rain. It is almost never the number that matters. The Tomorrow Fireworks Index scores 1,667 major U.S. displays on the Fourth of July from 0 to 100 — the share of a perfect show the sky will actually let you see.
Why the rain forecast is the wrong number
A clear night with a zero percent chance of rain can still deliver a mediocre show. A low cloud deck can hide the finale. Dead-calm air can fill the sky with its own smoke. In the northern U.S. in early July, it may simply not be dark yet when the first shell goes up. Rain is one of several things the sky decides on the night — and rarely the deciding one.
We stopped asking “will it rain?” and started asking the real question: of everything that has to go right for a great show, how much will go right tonight? That is what the Index measures.
One number, two halves
The Index is the product of two things: the chance the show fires and stays watchable, and — given that it does — how much of an ideal show you actually get.
Show Confidence is the probability the display goes off and stays safe to run, scored hour by hour and set by the worst one — a scrub risk at any point in the window drags the whole night down. Viewing Quality is the share of an ideal show you would see if it fires, weighted toward the finale, because the climax is what people remember. Multiply them and the result is a genuine expectation, not a yes-or-no.
A show that clears with 80% confidence and 75% viewing quality reads 60 — not “rain or shine,” but a calibrated fraction of a perfect night. That maps to four tiers on the map: Rough (0–39) — conditions make a good show unlikely; Compromised (40–54) — it fires, but something real gets in the way; Good (55–69) — solid show with one factor working against it; Great (70–100) — the sky is cooperating on every axis at once.
Those tiers are the output. Behind them are five criteria the sky either clears or doesn’t — each independent, each able to pull the whole score down on its own.
Five criteria between the mortar and your eyes
Picture the journey of a single shell — from the tube on the ground to the burst you see overhead. Five independent things shape the night along that path — four live in today’s score, the fifth, ground risk, still in testing. A perfect wind night does not buy back a low ceiling; each live criterion can pull the whole score down on its own.

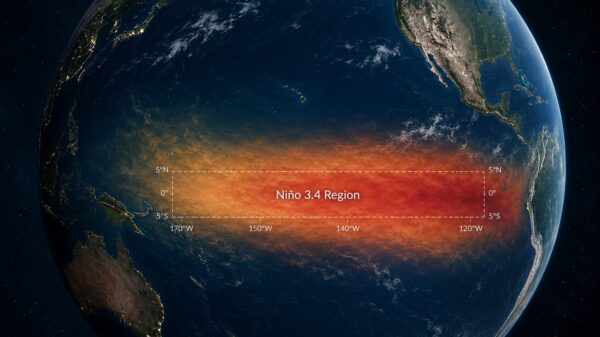
Cloud base vs. shell height. Shells travel several hundred to roughly a thousand feet before they break. If a cloud deck is sitting at burst height, the bursts vanish into it. A thin cirrus layer at 10,000 feet is invisible to this gate — it only penalizes cloud that sits below the shells.

Wind that clears the smoke. Every shell leaves a smoke trail. In dead-calm air that smoke stacks up, and by the finale you are watching fire through a haze. A light breeze is the sweet spot — enough to clear the air between shells, not so much that it smears the bursts sideways as they drift.

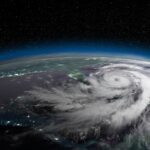
Does the show fire at all. The pass/fail criterion. Crews stand down for nearby lightning, for gusts that throw fallout off the range, and for rain heavy enough to soak the mortars. There is no single legal wind number — the safety code leaves the call to the operator’s read of the conditions — so the Index models what crews actually scrub for, not a threshold that does not exist.

Fire from the fallout. A display rains burning stars across a fallout zone the safety code sizes at 70 feet of radius for every inch of shell diameter — a large shell can drop embers 700 feet from the mortar. Whether they catch depends on the ground: cured grass and litter below about a quarter water content turn receptive, and the drier the season has been, the lower that bar sits. It is built and validated, but still in testing — not yet folded into the public score on the map.

Dark at showtime. Fireworks need contrast. In the northern U.S. in early July the sun can set at 9:15 while true dark does not arrive until well after ten. This gate measures how much darkness you actually have at showtime — which is why Seattle’s Fourth is famously washed out at ten o’clock.
The two clocks behind ground risk
Standard fire-weather tools watch an active blaze spread. Ground risk asks the opposite: will falling embers start one — on this exact patch of ground, this exact evening? Two clocks decide, and they don’t add up. They multiply.
Two clocks feed this criterion. The fast clock (tonight) is temperature and humidity — these set how dry the fine fuels are, running from non-receptive at about 25% fuel moisture to near-certain when the grass is bone dry. The slow clock (the season) is months of rainfall deficit, tracked via the Keetch–Byram Drought Index on a 0–800 scale — it decides whether the ground is primed before the evening starts.
The season’s deficit amplifies the evening — it doesn’t just stack onto it. The same embers that fizzle on rained-on ground can catch on grass cured by a month of drought. Built from each venue’s rainfall record (ERA5 reanalysis, June 2026), the drought clock reads about 628 around Phoenix — deep into the severe band — and about 186 in rainy Seattle, where the ground is rarely primed. The same evening forecast means something completely different over those two patches of ground. A water-launch site — a barge or a harbor — has nothing to burn, and skips this criterion entirely.
Why the score collapses the way it does
Confidence takes the worst hour, not the average. A scrub can happen at any point in the show window, so we take the minimum across the hours. One thunderstorm spike at 9 p.m. poisons the whole window, no matter how clear it looks at ten.
Viewing quality leans on the finale. The climax is the payoff, so each hour is weighted by how close it sits to the end of the show. A clear finale counts for more than a slightly hazy opening act — the way people actually remember a night.
The number is an expectation, not a promise. Forecasts carry uncertainty, so for every venue we also carry the plausible range under slightly better and slightly worse conditions. A narrow range means high confidence; a wide one means the night could still swing.
1,667 shows, one map
Every dot on the map is a point forecast for that exact launch site, pulled the evening before its show and read for what the sky will actually deliver. Comfort — how hot and sticky it feels — is tracked alongside but never folded into the score; a muggy night is unpleasant, but it does not make the fireworks disappear.
None of this requires a new sensor or a special model. It is ordinary weather data, read for a specific human question instead of a generic one. That is the whole idea behind the Tomorrow Fireworks Index: the forecast you already have, turned into the answer you actually want.
Eight ways to read the sky
The corpus holds 1,667 scored shows. These leaderboards cut those scores eight ways — where to go, and where to watch the conditions closely. Rankings shown are based on the July 3rd forecast run; figures update when the live forecast lands.
Where to be careful
All 1,667 shows, colored by what the sky will actually deliver — searchable by city, with the hourly forecast behind every score.
Every operation has its own five criteria
The fireworks case is the clearest version of a problem that runs across every industry the sky touches. Aviation stacks ceiling, visibility, and icing windows. Agriculture weighs vapor-pressure thresholds, frost thresholds, and harvest timing. Construction runs on wind cutoffs, pour temperatures, and ground saturation that compounds across days. Energy, logistics, events — each one faces the same failure mode: the generic forecast answers the wrong question.
The right question is always multidimensional: of everything that has to go right for this operation to run safely and well, how much of it will go right? Tomorrow.io is built around that question. Not weather as a backdrop — weather as a set of decision variables, each one scored against the specific conditions and thresholds your operation actually depends on. The same intelligence framework behind the Tomorrow Fireworks Index runs at enterprise scale across every sector where the sky is a business variable.
Sources & method
- NFPA 1123, Code for Fireworks Display. Fallout-zone geometry (70 ft of radius per inch of shell diameter) and the operator’s qualitative adverse-weather judgment — there is no numeric weather cutoff in the code — behind the Go Window and Ground Risk criteria.
- Schroeder, M. J. (1969); USFS GTR-082. The probability-of-ignition dose-response: fine dead-fuel moisture and the roughly 25% receptivity floor for cured fine fuels.
- Keetch, J. & Byram, G. (1968). The Keetch–Byram Drought Index, a 0–800 soil-moisture-deficit scale; computed per venue from ERA5 reanalysis history.
- Srock et al. (2018), Hot-Dry-Windy Index. The fast-clock fire-weather term combining wind and vapor-pressure deficit.
- Tomorrow.io Weather API. The hourly point forecasts — cloud, wind, precipitation, temperature, humidity — behind every show’s score.
- NOAA Solar Calculator. Sunset and twilight times behind the Sky Darkness criterion.