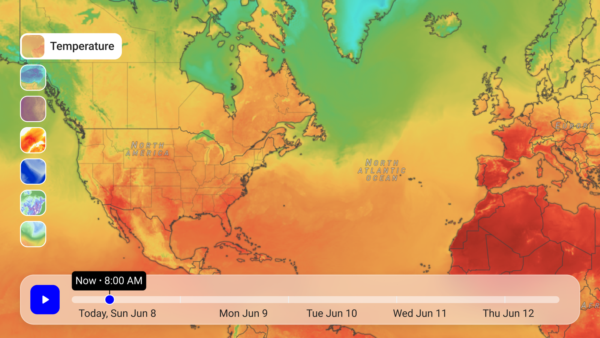
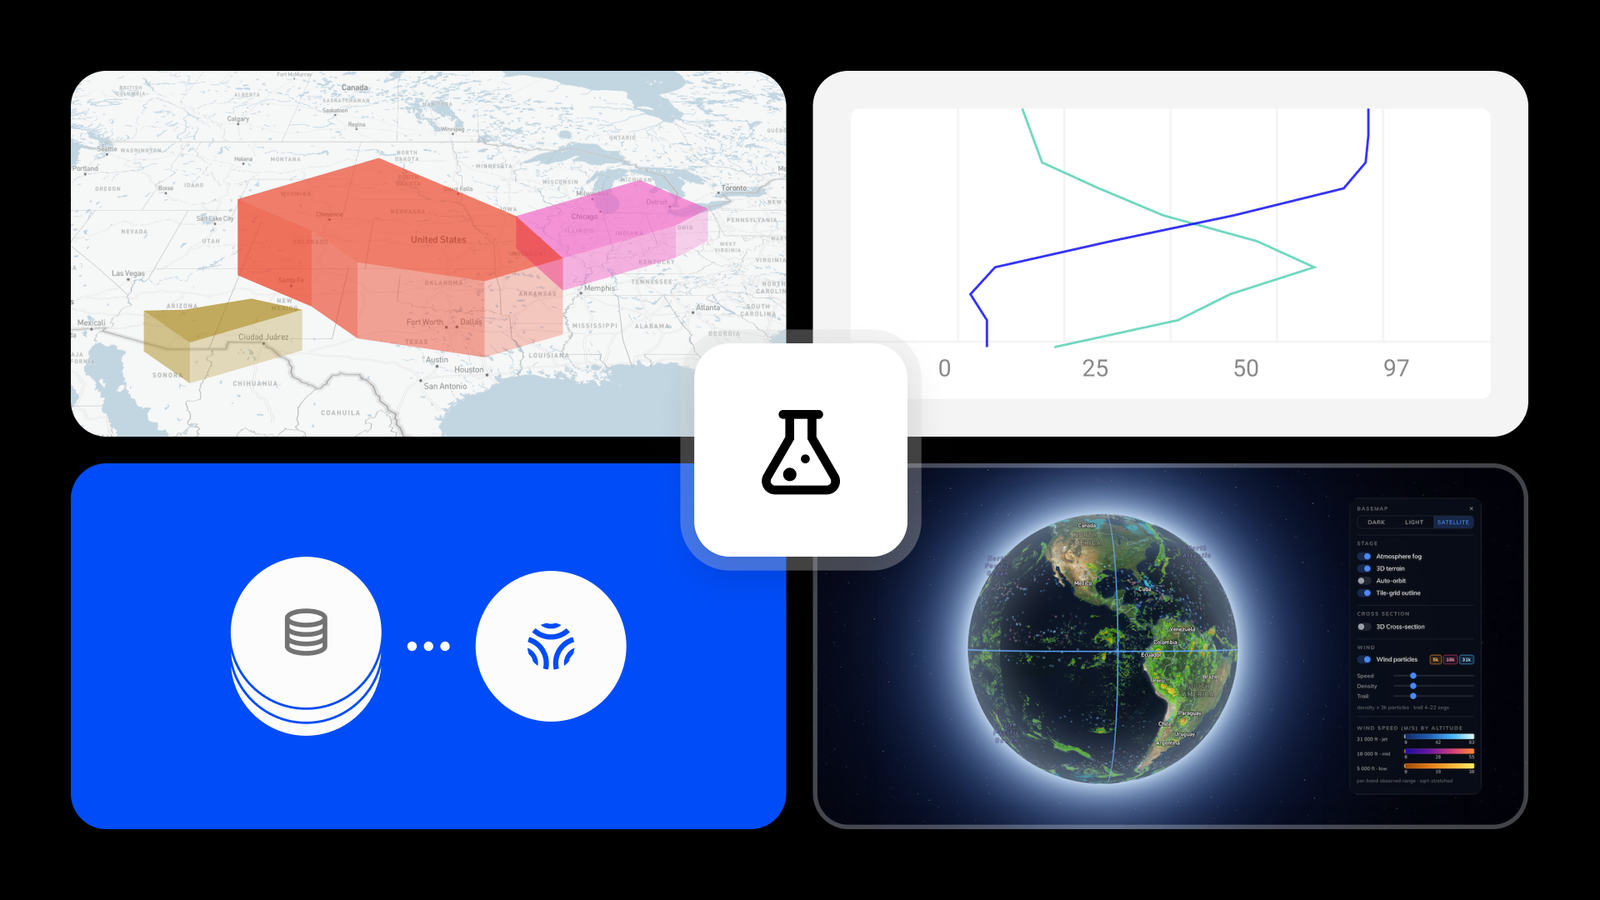
Labs — ready-to-run blocks from the platform: 3D fields, soundings, integrations, the wind globe. New ones keep arriving.
An airline doesn’t think in “weather layers.” It thinks in banks, holdover windows, and re-banking a schedule that just came apart. A live-event team thinks in holds and resumptions. A drone operator thinks in go/no-go, not radar returns. Labs is continuing to become an exceptional place where Tomorrow.io meets that personalization — capabilities organized around your industry and your use case, not a flat catalog you have to translate yourself.
This release moves that in two ways: it makes the maturity of every block visible, and it keeps growing the library of deployable experiences those blocks add up to.
Every block now shows its own maturity

Something that used to live in conversations with your account team is now stated in the product itself: exactly how far along a given block is.
Every block in Labs carries a visible lifecycle stage — from early concept, through beta, to generally available — with the stage and what it means disclosed right where you adopt it. By default, the Labs page shows the beta and generally available blocks open to your account, and where an experiment-phase block is available, you can opt in deliberately. So you know exactly what you’re adopting: an early look worth watching, or something ready to put in front of your team today.
Underneath the lifecycle, the page is organized the way you’d actually search it — by vertical, by use case, and by tag — so the block relevant to your operation surfaces instead of hiding in a list built for everyone.
The value of this is plain: early access without guesswork. Maturity that’s visible is maturity you can plan around.
A library organized around your world
A block only helps if you can find the one that fits your operation — so the Labs page no longer reads as a flat list. It surfaces blocks through categorized sections, like the latest blocks and new versions of ones you already run, and lets you filter by tag: #winter, #3D, #monitoring, #Experts. The block relevant to your world comes to you, instead of hiding in a catalog built for everyone.
What’s already there runs broad, and it maps to how teams actually work:
- Aviation and routing. The Insights Timeline surfaces impacted flights; RouteWX carries en-route weather with an altitude picker and a time slider; Diversion Assessment and Airport Conditions sit beside them.
- Severe-weather operations. The Lightning & Thunderstorm block and Tropical Cyclones put active hazards on the map.
- The forecasters and analysts on your team. Model Compare and Model Run Transparency open up the models themselves, while the Volumetric Data Viewer, Skew-T Explorer, Vertical Profiles, and the Atmospheric 3D Globe give them the atmosphere in depth.
- Ground transport. Road Risk reads the surface.
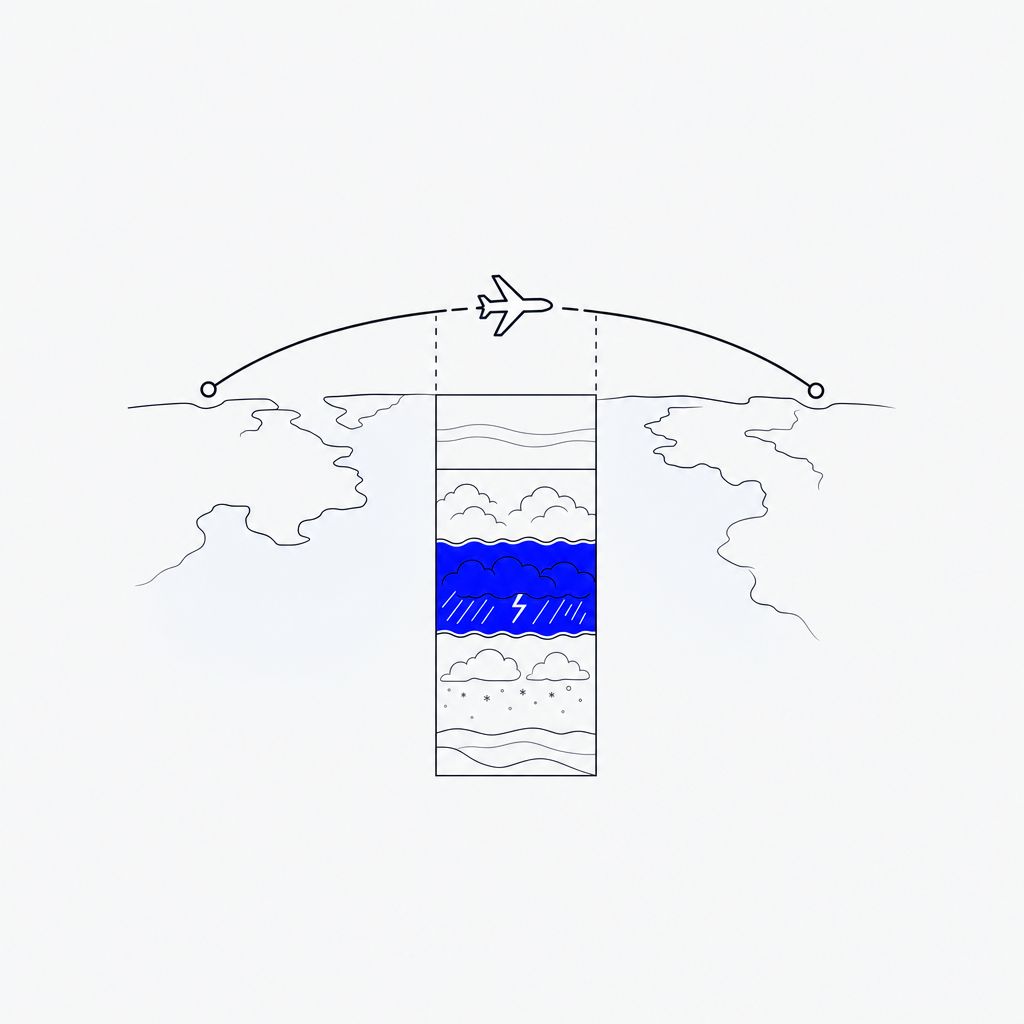
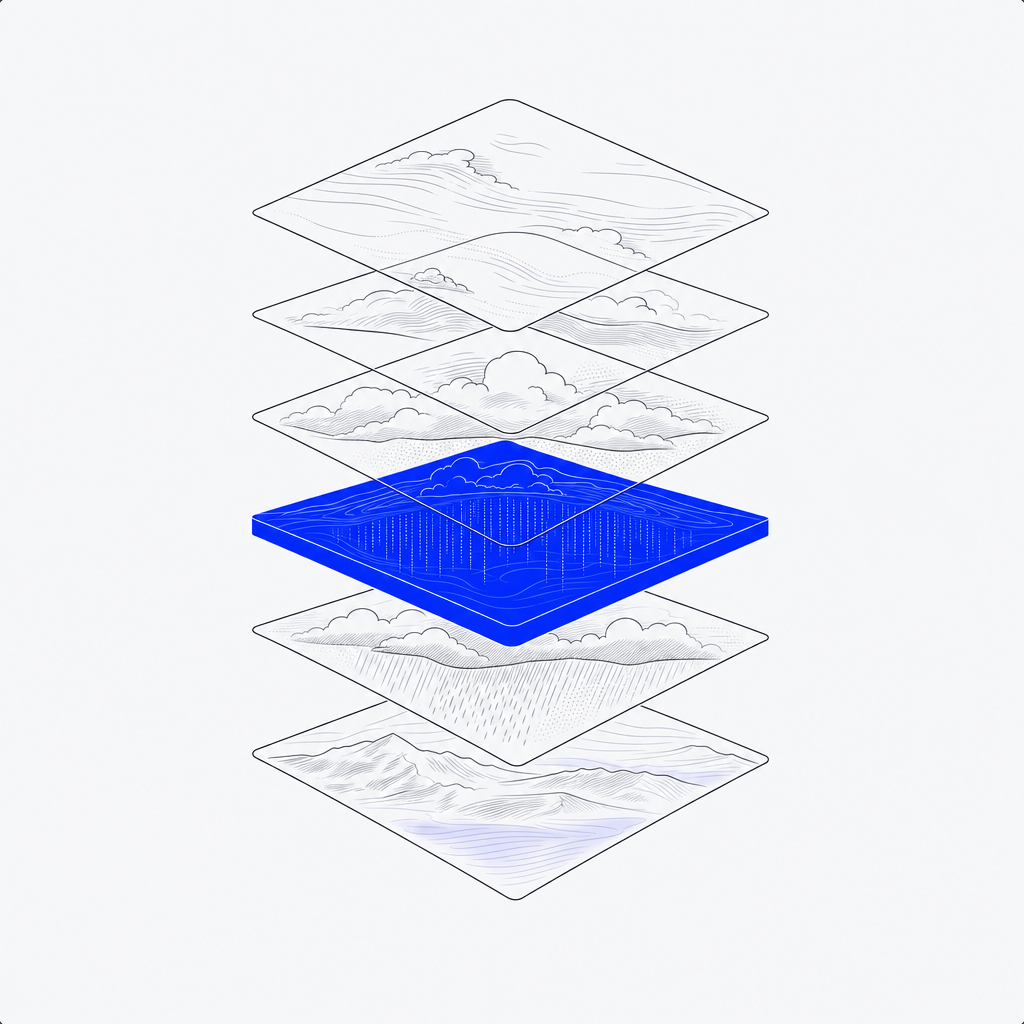
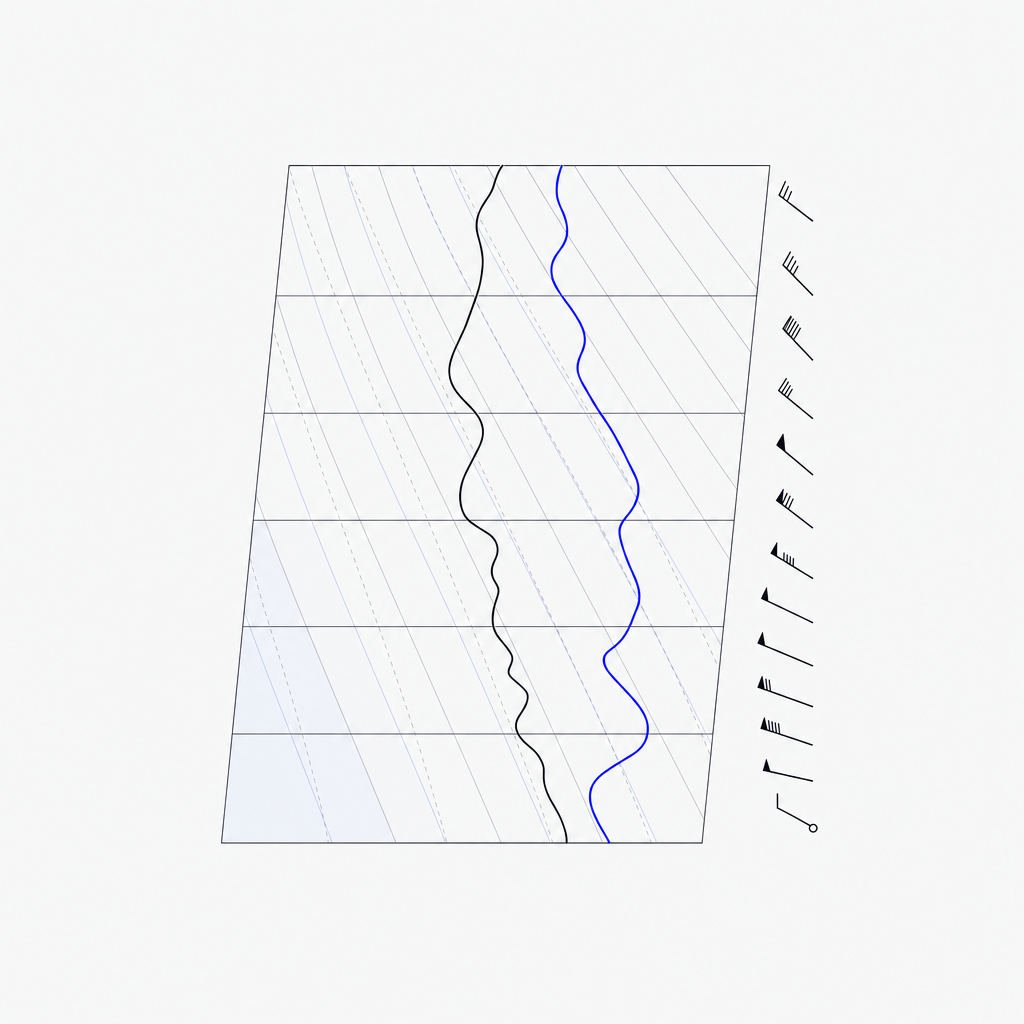

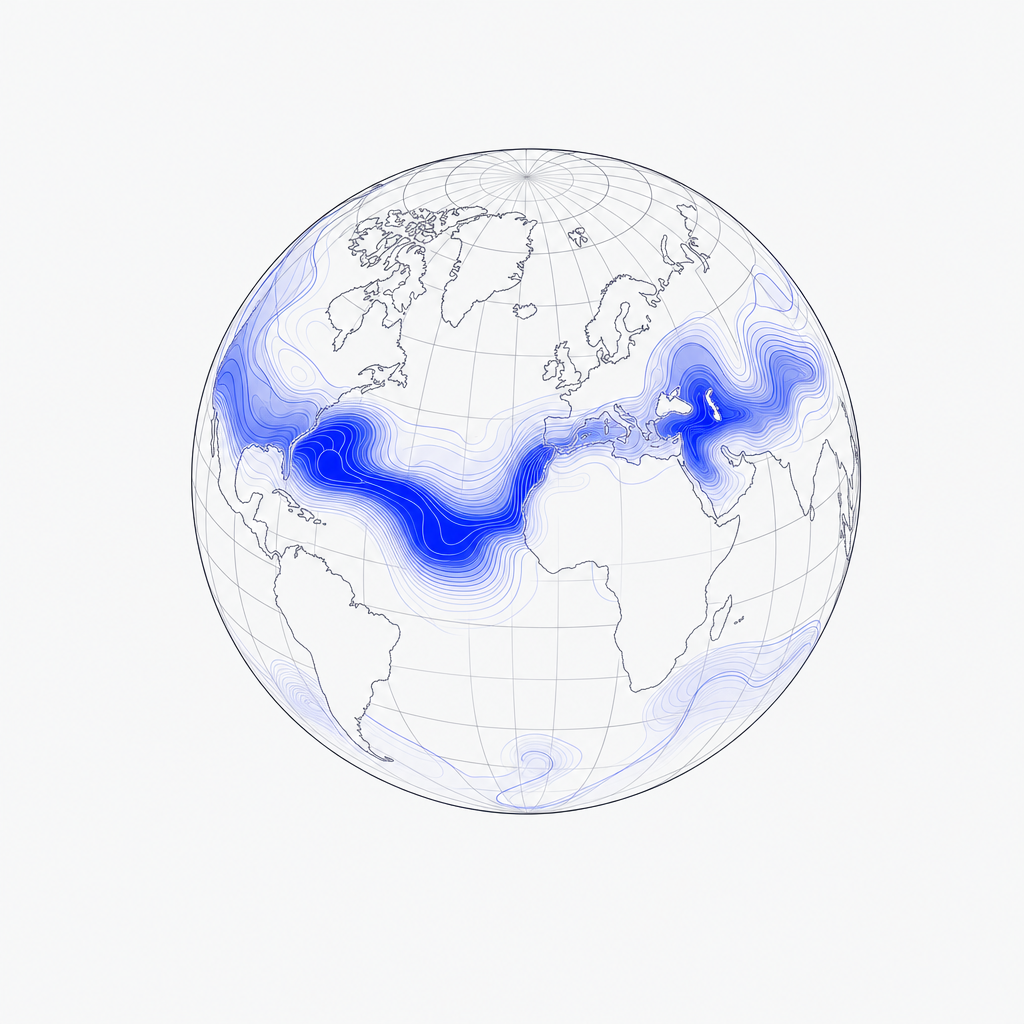

A few of the blocks, illustrated in our house style — not screenshots.
None of this is the whole list — new blocks land continually, each built through a repeatable workflow that keeps it consistent with the platform’s look and behavior. The library is less a fixed catalog than a growing shelf of ready-to-run value: a block comes off it and goes to work, the same day.
The hardest question, turned into a countdown
The clearest example of what Labs produces is the Lightning & Thunderstorm block.

It wasn’t built for one industry, because the hazard doesn’t pick one: the same storm cell stops an aircraft ramp, a stadium, a job site, and a pipeline crew. The block shows active strikes and thunderstorm activity on the map — and the part that changes an operation’s day, a safe-to-resume countdown. Not “is there lightning somewhere near us,” but the question every outdoor operation actually runs on: when can we start again? You can read it across every site you monitor at once, and drill into any single one.

Within thirty days of appearing in Labs, a major national sports broadcaster made it the most-added block on their dashboards. That’s the trade-off Labs exists to dissolve: a purpose-built experience, live and proving itself in an operation, without an eighteen-month build behind it.
Built from a direct ask, shipped the same quarter
The same release adds impacted flights to the Insights Timeline block, and makes that timeline exportable as a document you can share outside the platform.

The path this capability took is the point. Teams were triaging weather risk in the dashboard, then manually rebuilding the same picture to report it outward — so the ask came in, and the block closed the gap in the same quarter it was raised: conditions and affected flights in a single, shareable view, with impacted flights available to operations that connect their flight schedules, and exporting open to everyone.
That’s the loop Labs is built to run — your use case in, a working block out, on a timeline you can feel.
What’s next is up to you
We’re not printing a catalog here, because the catalog is the part that keeps changing. Browse Labs and you’ll find what’s open to your account, organized around your world. Opt into an experiment-phase block if you want to see where something is headed before it’s finished. And if the block your operation needs doesn’t exist yet — bring us the use case. The distance between “we need this” and “we have this” is shorter than it used to be.
← Back to the July 2026 Release overview
▽