The tactical model — for decisions that unfold while you are making them.
Many decisions have to be made while the event is unfolding in real time. A dispatcher has forty minutes before a bank of departures pushes back, and a line of light snow is lingering somewhere west of the field. A site lead has a concrete pour that cannot take rain mid-set. Neither is asking what the week looks like. Both are asking whether this reaches them, when, and whether they can finish the job in front of them before the conditions change.
Read how our sounders improve nowcastingSee the weather API reference

Published yesterday
The Tomorrow Modeling Stack, A Different Approach to Building Weather Models
Five windows, six models, and why the model that fits depends on the call being made.
The five windows, and the one this post is about:
Whether the thing reaches you, when, and whether the job finishes first.
Whether to commit or hold, while the options still carry leverage.
What to plan for, and how firmly, when the sources still disagree.
Whether it happened at all, where, when, and how hard.
What a place will bear over years, before a target is committed to it.
The calls made while the job is already running
What a decade taught us
Understanding the active state of precipitation, and then nowcasting it forward, was one of the first models we built. In 2016 we launched on a technique that took the freshest radar picture available and carried it forward through time. It was an unconventional approach then. It worked, it showed us there were new ways to think about improving prediction, and it helped trigger the early successes the company built a differentiated solution on.
It also taught us three things about leaning on traditional forecasting for these calls.
Filling the radar gap

This is what the world’s weather radar actually covers. Each point is a radar site, and the halo around it is how far that site can see. North America, Europe, Japan and Australia are well watched. Most of Africa, the interior of South America, central Asia, the high latitudes and every ocean are not. A great deal of the weather that matters to someone happens over the blank parts.
The usual way to fill that gap is with satellites parked high over one part of the globe, watching it continuously. They are invaluable, and they have a limit. From that height a storm is a lid of cloud: you can see that it is there, and you cannot see what is falling out of it.
A microwave sounder is a different instrument. It reads down through the cloud, layer by layer — how warm, how wet, at what altitude — which is a far more useful question to ask of a raining sky than what its top looks like. We operate a constellation of them ourselves, and they have been flying long enough, and steadily enough, to build a model around.

That last part is the difference. The conventional design puts the fixed satellites at the centre and treats a passing sounder as a bonus when one happens by. Ours is built the other way round. The sounders are the spine; ground radar where there is radar, the fixed satellites, and every other means of detection are fused in around them. If it had to, it could run on the sounders alone.
The satellites do not see rain the way radar does — they read the radiation a raining column gives off. So they were taught: wherever a satellite pass and a ground radar caught the same storm at the same moment, that pair became a lesson, and the network learned what the radar would have seen underneath. The physics of a raining column is the same over West Africa as over Oklahoma, so the lesson travels with the instrument rather than the geography. That is what lets Pulse nowcast where no radar watches, and lets an operator there see what is falling right now. For a great many regions it is the closest thing to radar they have ever had.
Today that picture is built on the Tomorrow constellation. DeepSky, our Gen-2 constellation now being built, adds to it as each new instrument comes online — more passes over the places that have never had a look, and a picture that keeps getting better underneath every model that starts from it.
Read the DeepSky announcementSee DeepSky
What Pulse does differently
Pulse is a by-product of years of innovation. For many of our customers it is the convergence of our existing Unified Precipitation and nowcast models into one solution, combined with a significant upgrade.
ScopeThose resolutions are the grid the forecast is written on, not a claim about what it can resolve. The retrieval is global; the projection runs over the continental United States and is expanding.
What’s new in this release
Both halves were rebuilt: the picture of what is falling, and the projection that carries it forward. Together they mean you can watch a storm change, not just move.
The picture of what is falling
It is now built around our own satellites, with every other observation fused in around them — rather than the other way round.
- Heavy rain from thunderstorms reads clearly now. A sounder tells you where rain is falling. Other means of detection, fused in alongside it, tell you how hard a storm is working — and together they pick out the heavy rain a thunderstorm throws down, which the version before under-read. This set keeps growing.
- You can see inside a tropical cyclone. From above, a storm like that is a lid of cloud and nothing else. The sounders read underneath it, so the bands and the eye are visible while the storm is still completely covered.
- Cold mountain tops are no longer mistaken for storms. The version before read them as cloud and put rain on ridgelines where none was falling. Anyone working a mountain pass can trust what the map shows there now.
- The edges of the map are as good as the middle. A satellite that sits over one spot sees the far edges of its own view at a shallow angle, and the picture thins out there — high latitudes, distant coastlines, the middle of an ocean crossing. The sounders cover those places, so a call made out there rests on as much as a call made anywhere else.
- It is steadier than it was. Instruments have off days: a channel drops, a pass comes in at an awkward angle, a source goes quiet for a while. The new picture was built to keep going through that, and it behaves the same way over one part of the world as another.

What carries it forward
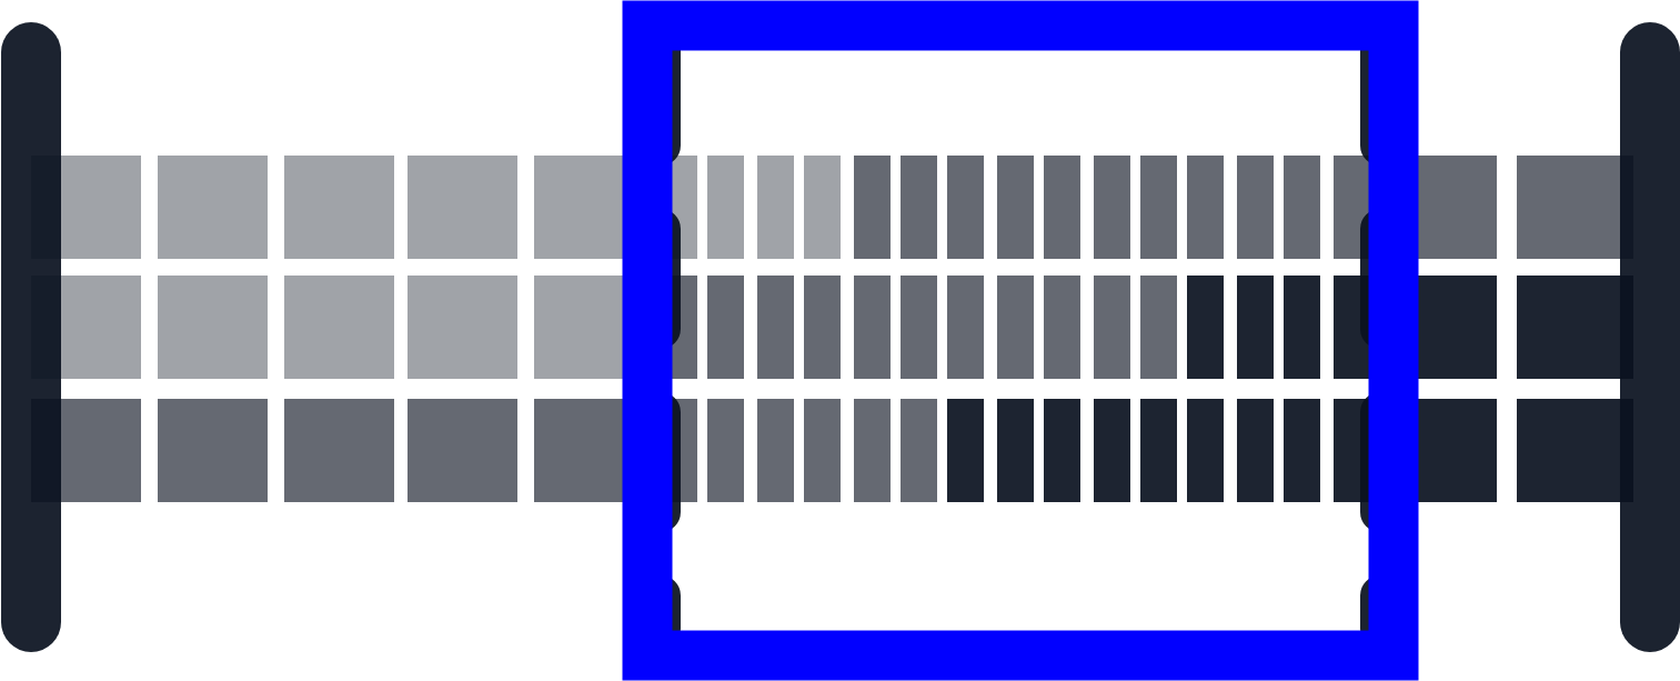
The old method took the last picture, measured which way it was moving, and slid it. The new one has learned from years of real storms how they actually behave.
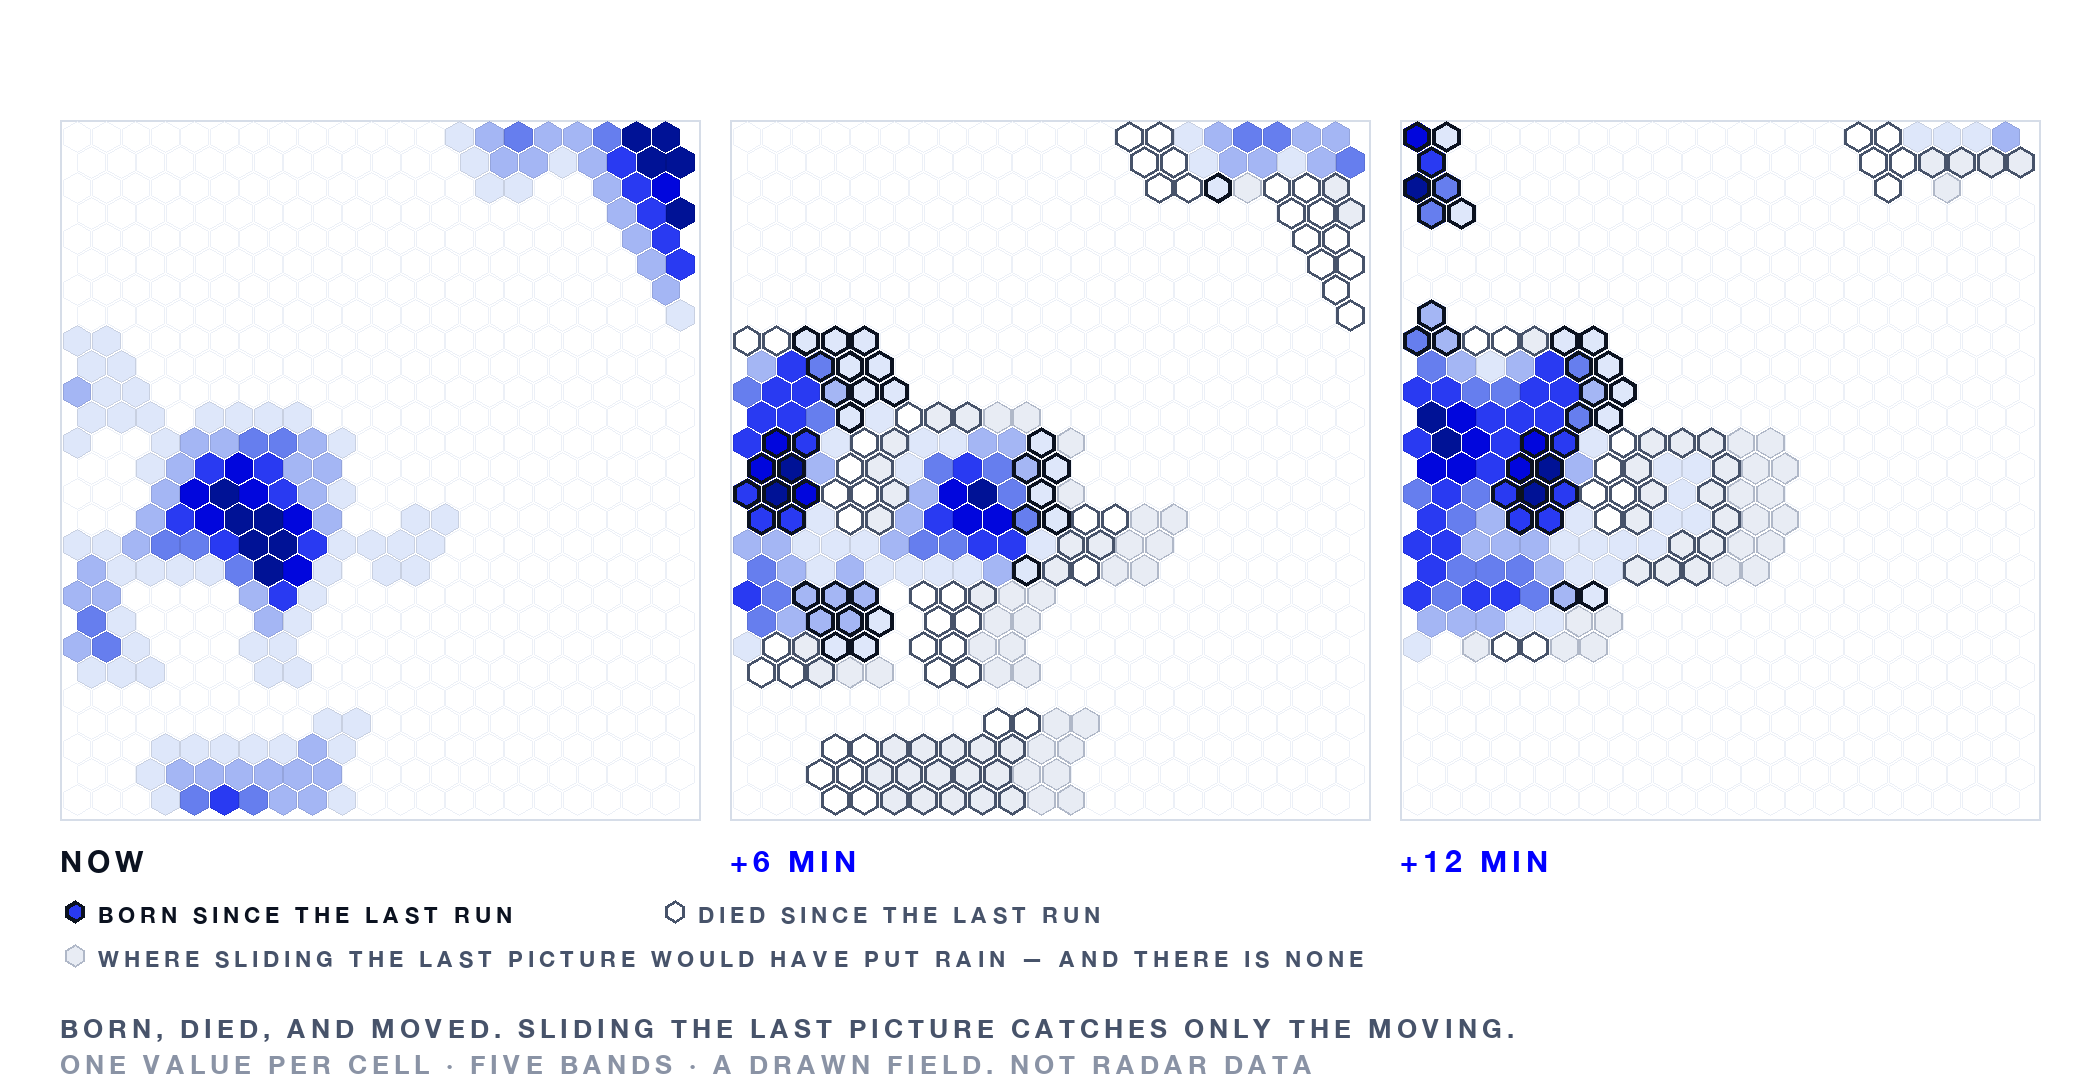
- It calls the start. Sliding a picture forward cannot produce rain that was not already in it, so the version before routinely missed the moment rain began. Calling the onset, and its timing, is where this release moved the most.
- It arrives sooner. The delay between a new observation and an updated projection is shorter by up to six minutes. At this range that is the difference between a picture you can act on and one that is already history.
- The ground is part of the forecast. Terrain and land cover now feed the projection, so a storm behaves differently coming off a ridge than crossing open plain — the way it does in the sky.
- Storms keep their shape and their strength. The old approach blurred a storm toward an average as it looked ahead, and under-called heavy rain. This one holds the structure and the intensity of a cell out through the window.
On theseEach is stated against the version it replaces. In this first release, telling rain from no rain over the United States is about as good as the version before at light rates, and better in storms. No accuracy figure is claimed against any other model or forecasting centre.
The bottom line
The dispatcher does not get a better forecast. They get a picture six minutes old instead of an hour, and one more look before the bank pushes. The site lead gets the same thing before the concrete goes down. On a bad afternoon that is the difference between a sequence and a scramble.
At this range, being current beats being clever.
It just needed its own name
We were told, in 2016, not to call it a nowcast. The word sounded like less than a forecast.
It turned out the tactical horizon was not a lesser version of forecasting. It was its own discipline, with its own methods, and its own decisions riding on it.
Already published
Five windows
The Tomorrow Modeling Stack, A Different Approach to Building Weather Models
Five windows, six models, and why the model that fits depends on the call being made.
Still to come
What is about to happendays out, then weeks out

One to two days out
Weighing a decision instead of forecasting one
Why one model is not enough when the call has to be made against a threshold.

One to two weeks out
What a plan can and cannot assume
Where the largest moves live and certainty is lowest, and what a model is for when it cannot give one answer.
What already didweeks back, then years of record

Hours to weeks back
Proving what actually happened
Not what a place tends to see and not a summary — whether it happened, where, when, and how hard.

Years of record
Understanding the total risk exposure of a target asset or job
Recreating the past so what a place has been exposed to can be argued from the record rather than from memory.
In testingWe have been running this one with partners for over a year.
Where to start
Set up a working session to understand your workflows, and which models are best positioned to improve your operations.
Or build on it directly
The same models sit behind the API. You can start pulling from them without talking to anyone first.