The brake the system pulls
A ground stop is the bluntest instrument in air traffic management: an order from the FAA’s command center that every flight bound for an airport stays on the ground, wherever in the country it happens to be waiting. Controllers use it when conditions at the destination — most often weather — make arrivals unsafe or impossible to sequence. It is the system working as designed: the brake gets pulled so the crash of demand into a shrunken airport never happens in the air.
Since 2000, the command center has published every one of those orders in its advisory database. Net of cancellations, that record holds 87,868 ground stops — a quarter century of exactly when, and where, the sky stopped taking arrivals, and, in the body text of each advisory, why.
Half of summer lands in four hours
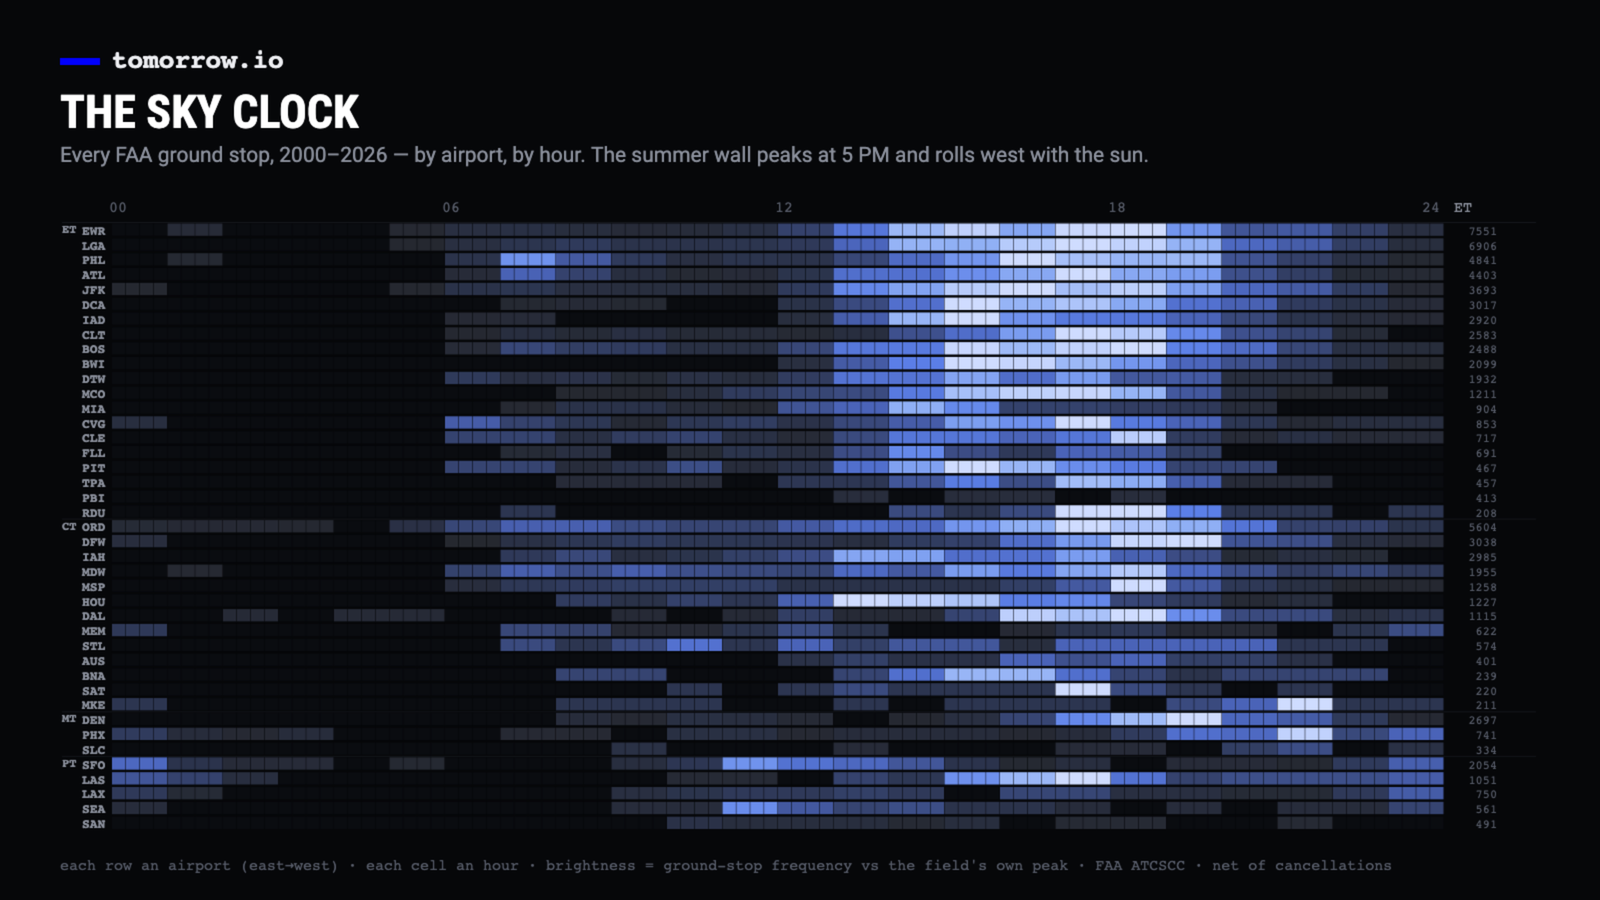
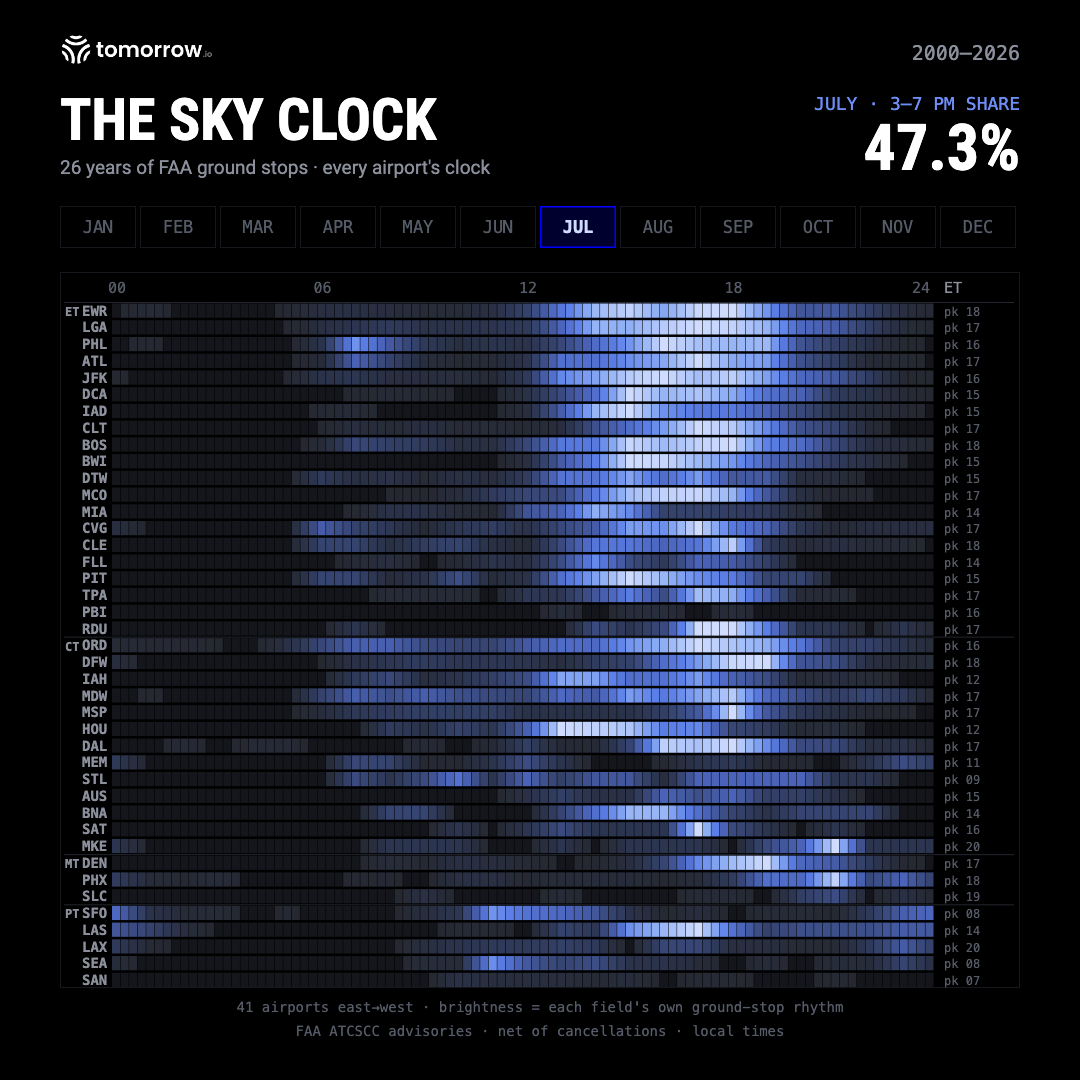
Put every July stop from those 26 years on a single 24-hour clock, local to each airport, and the shape is not subtle. 47.5% of July’s ground stops are issued between 3 and 7 p.m. local time. The single worst hour is 5 to 6 p.m. Mornings barely register: 13.9% of July’s stops happen before noon — the whole first half of the day carries less than a seventh of the load.
The signature isn’t the flight schedule
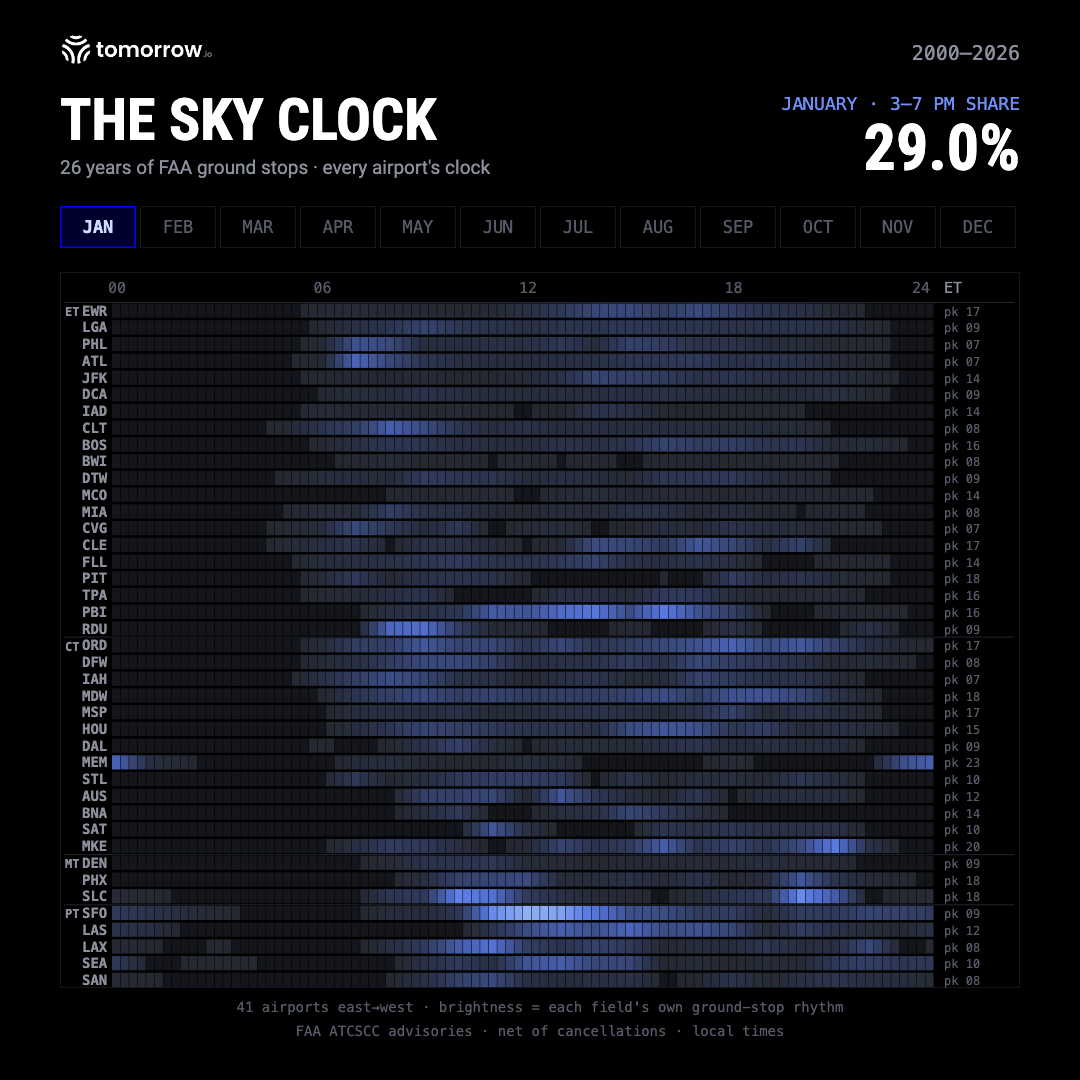
Airlines fly a two-humped day — a morning departure bank and an evening one. If ground stops simply tracked traffic, the clock above would show two humps too, and it would look roughly the same in January as in July. Neither is true. The July curve is a single spike that builds from noon and peaks at 5 p.m. — the build-and-release rhythm of daytime heating. And the volume collapses with the seasons: July runs 12,279 stops across the record; January runs 4,409. Traffic doesn’t triple in summer. Thunderstorm season does.
But the shape isn’t the only evidence — we can read the FAA’s own reason. Every ground-stop order carries a stated cause in its body text: weather / thunderstorms, volume, equipment. We parsed that field for 62,307 orders, sampled evenly across all 26 years. Of every ground stop with a stated cause, 80% cite weather and just 7% cite volume. Narrow to the summer 3–7 p.m. wall itself, and the weather share climbs to 92%. The rush-hour theory — that the afternoon peak is only heavier traffic — is the first thing the record rules out: barely one stop in thirty in that window is attributed to volume.
One honesty note: that reason sample covers about 28% of the roughly 220,000 ground-stop and delay-program advisories in the record — large and spread evenly across every year, but not the complete census. The 92% has held steady as the sample has grown, so a fuller count would sharpen the figure rather than move it.
Winter keeps different hours
January doesn’t just run quieter — about a third of July’s volume — it runs on a different clock. The afternoon share drops to 28.9%, and the weight moves to the morning: 39.8% of January’s stops are issued before noon, with the single busiest hour at 8 a.m. Fog, ice, and the slow grind of de-icing own the winter morning; by afternoon, the system has usually found its footing. Summer concentrates. Winter scatters.
We’ve written before about which months disrupt aviation — winter breaks the schedule, summer bends it (that record is here). The Sky Clock is the other axis of the same public record: not which month, but which hour.
Every airport keeps its own clock
The national curve is an average, and averages flatten personalities. Line the airports up field by field and each one keeps its own time. Newark’s July stops peak at 6 p.m.; Denver’s at 5 p.m. — convection country, both. Then there’s San Francisco, which never joined the afternoon wall at all: its stops peak at 8 a.m., because its signature constraint is the marine layer, not the thunderstorm. And SFO mostly doesn’t get stopped — it gets metered. Roughly four of every five weather actions there are planned delay programs rather than emergency stops: stratus burns off on a schedule, so the FAA plans around it before the morning push, most mornings starting at 6 a.m.
One storm, read in brake lights
The clock is the law; a single night shows the mechanism in motion. On June 29, 2012, a derecho — one continuous line of violent thunderstorms — crossed from the Midwest to the Atlantic in an evening. You can follow it in the advisory record without a single weather observation, because the brake lights come on in the storm’s path, in order:
Chicago at lunch, Ohio at dinner, Washington by night — the storm’s track, written in air-traffic advisories. That is what it means for the sky to run on a clock: the disruption is not random, and the system that manages it already acts on timing. The stops fired ahead of the line, at the moment the arrivals stream had to be cut.
The clock is public now
Everything above comes from a public record — the FAA’s own advisory archive, the same one airlines and dispatchers have always been able to read. What’s new is only the assembly: 26 years of it, on the one instrument at the top of this page. Play the year and the whole shape of the sky’s disruption turns in front of you — no forecast, just the record, laid out to read.
The airlines’ operations centers and the FAA already plan against this rhythm; it’s their record. What weather intelligence adds is the forward half of the same discipline — reading the conditions that build toward a 5 o’clock wall in the hours before it stands up. That’s the work our aviation weather intelligence does, and the 26-year clock above is the ground it stands on. This is the second page of a larger instrument. The first mapped the months. This one maps the hours.
More analysis on weather and flight disruption.
This is one piece of our work on how weather shapes air travel. We’re taking on the rest — the hours that constrain a schedule, the cost of a delay, how a single storm cascades across a network. Leave your email and we’ll send the next analysis when it’s ready.
One email when there’s new analysis worth your time. No noise — unsubscribe anytime.

How to read the Sky Clock
Each row is an airport, arranged east to west; each column is an hour of the day; brighter cells mean more ground stops at that hour. Every airport is aligned to Eastern time, so the afternoon wall’s westward roll across the country is visible, and the right rail shows each field’s peak hour and its 26-year total. Play the year to watch the summer wall build and scatter into winter; hover any hour for the exact count. Source: FAA Air Traffic Control System Command Center advisory archive, 2000–2026 — a federal public record (17 U.S.C. §105); 87,868 ground stops, realized history, not a model; the 41 highest-volume U.S. hubs shown.
Sources
- FAA ATCSCC / NAS Status advisory archive, 2000–2026 (public domain, 17 U.S.C. §105). All ground-stop counts net of cancelled advisories: 87,868 across the record. Hourly attribution: issuance timestamps converted to each airport’s local time, daylight-saving aware; 94% of net advisories carry a mapped airport; the instrument pictured shows the 41 highest-volume fields.
- Tomorrow.io Aviation Weather Intelligence (2026), The Sky Clock analysis. Monthly × hourly shares in this article: July 47.5% (3–7 p.m.) and 13.9% (before noon) of 12,279 stops; January 28.9% and 39.8% of 4,409; peak hours per airport (EWR 6 p.m. / DEN 5 p.m. / SFO 8 a.m., July); worst-day ranking (16 of the top 20 between late June and early August).
- FAA ATCSCC advisory reason enrichment (Tomorrow.io, 2026). Structured cause field parsed from the advisory body text of 62,307 orders — about 28% of the ~220,000 ground-stop and delay-program advisories in the record, drawn by fixed-seed shuffle to spread evenly across all 26 years. Ground stops with a stated cause: 80% weather / 7% volume (n=32,478); the summer 3–7 p.m. window: 92% weather / 3% volume (n=4,923); delay programs: 83% weather (n=25,966). Source text: FAA ATCSCC advisory database, fly.faa.gov/adv (public domain). Representative sample, not the complete census; the 3–7 p.m. weather share held at ~92% across sample sizes.
- The June 29–30, 2012 derecho sequence — same archive: ORD ground delay programs from 15:13 UTC; CMH ground stop 23:37 UTC; IAD 00:08 / DCA 00:10 / BWI 00:16 UTC; re-issues through 02:54 UTC.
- SFO planned-program share: ground delay programs ÷ (ground stops + programs) = 81% on the net advisory basis above, 2000–2026.