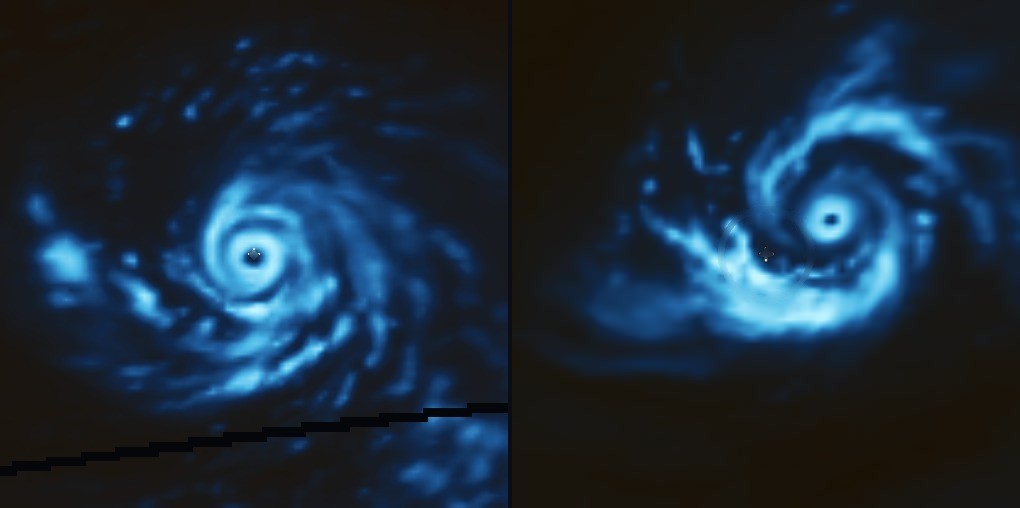
Two Category 5 super typhoons over the same islands, three months apart: Bavi (left) near peak intensity on July 4 — two days before its eye crossed Rota — and Sinlaku (right), which struck the same chain first, in April. In each, cold, high cloud tops (bright) wrap a clear, warm eye (dark) — a structure that forms beneath the cloud canopy, where ordinary satellites can’t see it. Both are microwave scans, which see through it.
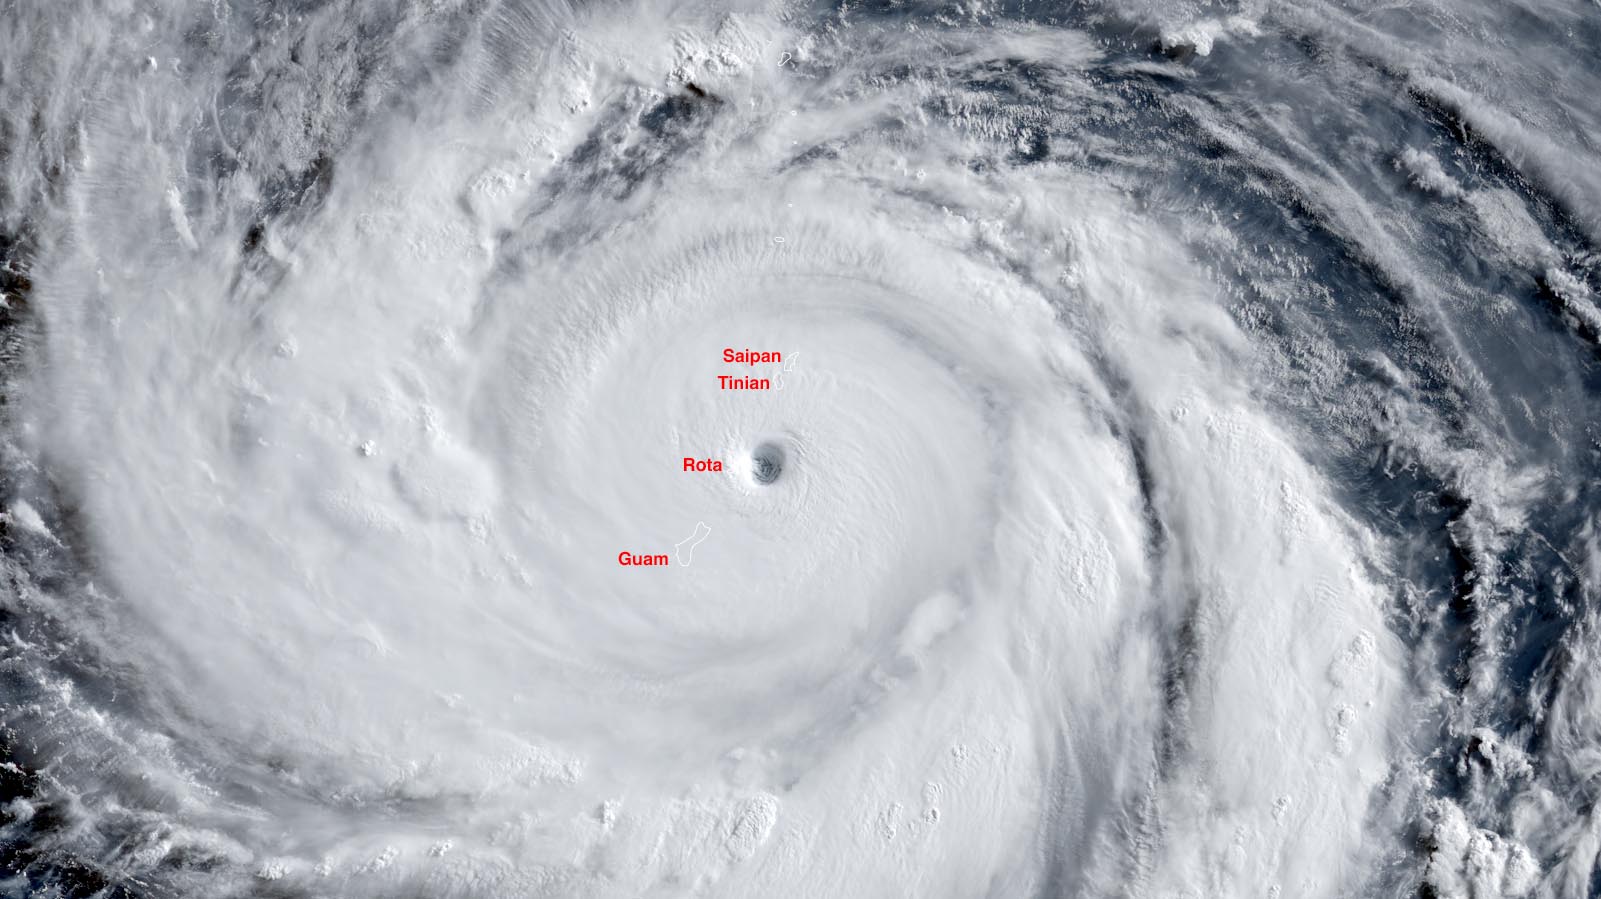
Early Monday, the eye of a Category 5 super typhoon passed over the tiny island of Rota. It was the second Category 5 to strike the Mariana Islands in three months — both born in a single day of explosive intensification — the second bearing down on islands still recovering from the first.
The eye over Rota
Super Typhoon Bavi began Tuesday, July 1 as a modest tropical depression over the warm water east of Guam. Japan’s meteorological agency named it the next day. Over the following forty-eight hours it evolved from a Category 1 to a Category 5 — and kept climbing from there, peaking near landfall on July 5 with roughly 180-mph sustained winds.1
1 Peak-intensity estimates differ by agency and by averaging standard — the U.S. Joint Typhoon Warning Center’s one-minute winds ran to about 178–180 mph near landfall; Japan’s ten-minute standard puts it near 125 mph; central pressure settled around 910 hPa. They describe the same storm, measured differently. We use the JTWC one-minute figure here.
Sunday night the rain reached the islands; Saipan lost power before midnight. On Monday morning the eye made landfall directly over Rota — an island of roughly 1,500 to 2,000 people and 32 square miles — with an eyewall carrying those ~180-mph winds. Assessments described major damage: flipped cars, flash floods, and power, water and communications knocked out, with one early estimate warning parts of the island could be uninhabitable for weeks. On Guam, power failed island-wide, the airport clocked a 110-mph gust, and roughly ten major roads were left impassable. As of Monday evening, no deaths or injuries had been reported — a genuinely notable outcome for a Category-5 landfall, though with clean-up still hampered by dangerous conditions, the full picture was still emerging.
The second time
Bavi is the third Category-5 storm anywhere on Earth in 2026 — and the second to find this same island chain. For a small island chain to take two of the year’s strongest storms three months apart is rare. The first of the pair, Super Typhoon Sinlaku, was itself the tenth Category-4-or-5 to strike a U.S. state or territory in ten years — a count that matched the total of the previous fifty-seven years combined.
Category-4-or-5 strikes on U.S. states & territories
Sinlaku was the 10th in a decade — a count it took the previous 57 years to reach.
Seen from orbit
This is what a storm doubling its wind in a day actually looks like from above — the view forecasters need most, and the hardest one to get. Every frame below is a real microwave scan of Bavi and Sinlaku, centered on the eye and laid over the looks from the previous few hours, the way a fleet of satellites fills in one another’s gaps — not a model, not a simulation. The wind figure in the corner is the official best-track intensity at that moment.
Super Typhoon Bavi, July 2026 — from a forming system to the Category-5 eye that crossed Rota. Every keyframe is a measured microwave scan; the dissolves are time-lapse, never invented cloud.
Super Typhoon Sinlaku, April 2026 — the same instrument, the same island chain, three months before Bavi arrived.
Sinlaku, in April
On April 12, Sinlaku peaked at about 185 mph — the strongest storm on Earth in 2026 to that point, and the strongest Northern-Hemisphere storm to form in April since 2021. An eyewall-replacement cycle weakened it to Category 4 before it reached land, which almost certainly spared lives. Even so, when its large eye crossed Tinian and Saipan at the same time on April 14, it came in at Category 4, ~145 mph, and parked over the islands for more than a day.
The recovery was nowhere near finished when Bavi arrived. Tinian was still without grid power weeks later; one Saipan village went more than five weeks in the dark; the deadline to even apply for federal disaster aid had passed barely two weeks before the second storm.
[My power] had been restored just four days ago. But now it’s out again. — Edwin Santa Theresa, 56, Tinian resident (to AFP, July 2026)
El Niño showing its signs
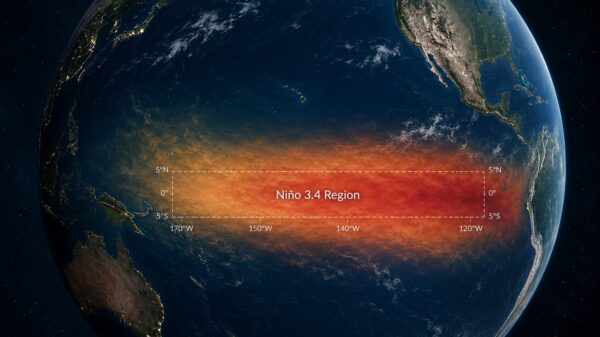
We wrote about the mechanics of this El Niño when NOAA declared it in June. What matters here is what the signal does in the Western Pacific: it pushes typhoon genesis eastward — toward the Marianas’ own longitude, away from the region’s usual cradle near the Philippines — and more time over open water is more time to intensify. NOAA’s Western North Pacific outlook for 2026, issued in June, said it directly: the eastward shift “allows TCs more time to intensify, resulting in a larger number of major typhoons (Categories 3, 4 and 5) that could impact the Marianas and western Micronesia” — naming the CNMI and Guam as above-normal-activity regions, three and a half weeks before Bavi existed.
Our own tracking shows the same drift, storm by storm. Sinlaku, forming in April as the Niño-3.4 anomaly first neared the +0.5°C threshold, was born about 500 nautical miles east of Guam; Bavi, forming in July with El Niño declared and strengthening, about 1,100 — more than twice as far out, further along the same signal. None of it made either storm a certainty; the same outlook is careful to say an elevated-risk season “does not indicate how many of these systems will actually make landfall.” El Niño raised the odds; it did not guarantee either storm.
Rapid intensification, and the gaps
Both storms did the single hardest thing a tropical cyclone can do to a forecast: they rapidly intensified. Rapid intensification, or RI, has a specific meaning — the standard threshold, used by U.S. hurricane forecasters, is a gain of at least 35 mph in 24 hours (30 knots). It is where forecasts break, and it is the most dangerous way for them to break: a community can prepare for a tropical storm and have a Category 5 arrive. Much of the distance between “shelter where you are” and “leave now” comes down to how early the climb is caught.
For the Western Pacific this season, the conditions that drive that climb were forecast to be unusually common. NOAA’s 2026 outlook for the region, issued weeks before either storm, expected the El Niño pattern to shift storm formation eastward and give systems “more time to intensify, resulting in a larger number of major typhoons” near the Marianas and western Micronesia. An elevated-risk season is not a forecast of any one storm — but a year primed for hard intensification is the backdrop against which these two formed.
Even against that backdrop, both climbs stand out. Bavi more than doubled the RI threshold: over a single day and a half its winds rose from roughly 60 mph to 160 mph — about a 100-mph gain in 36 hours, and roughly 80 mph in its fastest 24. Sinlaku’s climb in April was just as steep, gaining about the same in its fastest day. Two storms, three months apart, over the same small island chain, both intensifying about as fast as storms do.
Why they intensified that hard is, honestly, not settled — the mechanics of the most extreme RI are still an open question in the science. What can be measured is something narrower and, for a forecaster, just as consequential: how often anyone was able to look at the core while it was happening. The structural tells of a storm about to climb — the eye clearing, the eyewall drawing into a tight ring — form beneath the high cloud canopy that ordinary weather satellites see from above. Only microwave sounders see through that canopy to the structure underneath, and a single microwave look is a snapshot that ages quickly. So the coverage of an intensifying storm is really a count of looks over time — and in the fastest part of each of these climbs, that count had a hole in it.
In each storm’s fastest stretch, there was a window when the existing public weather satellites — the constellation of American, European, Japanese and Chinese microwave sounders that carries this job today — happened to leave the longest gap between looks. For Bavi that longest gap ran 3 hours 43 minutes; for Sinlaku, 8 hours 42 minutes. These are not failures — they are orbital mechanics. A given satellite passes over a given patch of ocean only when its orbit brings it there, and the gaps are where those schedules line up badly over a storm that will not wait. During both of those windows, Tomorrow.io’s satellites happened to be passing, and returned looks from inside the gap.
The panel below shows exactly that, and only that. Each storm is one horizontal bar, and the two bars are drawn to the same time scale — so Sinlaku’s gap reads as more than twice as long as Bavi’s because it was. The dashed outline of each bar is the coverage gap itself: the single longest stretch, during that storm’s fastest climb, that the existing public satellites went without a look. Each vertical blue tick inside a bar marks one Tomorrow.io pass, placed at the real time it occurred within the gap — four looks inside Bavi’s gap, ten inside Sinlaku’s. The figure at the right of each bar is that gap’s length.
What repeats across both storms is the shape in the panel above: the longest gap arriving just as the storm climbed fastest, with a denser constellation able to put a few more looks inside it. One storm could be luck; the same pattern twice is closer to a capability.
The same record, laid out as it was captured: twelve microwave overpasses of the two Category 5s, one row each, ordered up each storm’s climb from tropical storm to peak. Every tile is a real scan — the crosshair marks the fixed storm center; where a satellite’s swath only clipped the storm, the frame is labelled at the edge rather than filled in. Wind is the JTWC best-track at the scan time.
 MEASURED SCANSWATH EDGE
 MEASURED SCAN
 MEASURED SCAN
 MEASURED SCAN
 MEASURED SCANSWATH EDGE
 MEASURED SCAN
 MEASURED SCAN
 MEASURED SCANSWATH EDGE
 MEASURED SCAN
 MEASURED SCAN
 MEASURED SCANSWATH EDGE
 MEASURED SCAN
MEASURED SCAN — real microwave overpassSWATH EDGE — the pass clipped the storm; no data is invented
Source. Each frame is a Tomorrow.io microwave sounder scan (ch12, center-registered); labels give the satellite, the overpass time (UTC), the JTWC best-track wind at that time, and the miss distance from the eye. Winds and category climb come from the IBTrACS/JTWC best-track; Bavi is shown through its intensification window. Nothing here is a forecast or a composite.
Thirteen satellites, and eleven more
None of what you just read replaces the people whose job is the warning. The alerts that moved Rota into shelters belong to the agencies that issued them — that is their job, and they are good at it. What a dense commercial constellation adds is the one thing rapid intensification demands most: more looks at the core, sooner. We equip the people who use them. And the forecast agencies are moving the same direction themselves: NOAA’s national satellite service recently contracted to buy commercial microwave-sounder data like ours, with tropical-cyclone prediction among the intended uses.
Constellation · The FleetSix programs · four nations
Composition matched against NASA CMR granule records
That is the point: not who scanned more, but how much more of the sky is watched now than three years ago.
What the two storms say together
The lesson isn’t about any one storm, or any one satellite. The hardest problem in this field — a storm that doubles its wind in a day — is, underneath, a problem of how often you can look. The Marianas faced two of the year’s strongest storms in one season. Catch the climb earlier, and the people underneath — in Rota, in Tinian, in every village still rebuilding from the last one — get more time to decide, again, whether to stay or go.
Sources & method
- Storm intensity & track. Both storms’ peak intensities, category history, rapid-intensification figures and landfall positions follow the official post-storm best-track record for the Western North Pacific (JTWC one-minute sustained winds). Bavi’s landfall geometry over Rota is additionally corroborated by ground-based radar analysis.
- Seasonal outlook. NOAA / National Weather Service, Weather Forecast Office Guam — 2026 Western North Pacific Tropical Cyclone Outlook for the U.S. Affiliated Pacific Islands (issued June 2026): the El Niño–driven eastward genesis shift and the above-normal-activity call for the CNMI and Guam.
- Impact & recovery. Contemporaneous reporting and official statements from Guam and CNMI authorities on both storms’ damage, power and shelter status, casualties and the ongoing recovery across the Marianas, Chuuk and the wider region — including Sinlaku’s 17 fatalities and losses exceeding $1.55 billion.
- The islands & their communities. Standard historical and demographic references for Rota, Tinian and Saipan — CHamoru and Carolinian settlement, the region’s political status, and community profiles.
- NOAA / NESDIS, Commercial Data Program (June 2026). NOAA’s award to Tomorrow.io to acquire commercial microwave-sounder data for its forecast systems, with tropical-cyclone prediction among the stated uses. The award is the fact cited; the data’s operational impact is being assessed, not yet demonstrated.
- Coverage analysis (Tomorrow.io). The look counts, crossing ledgers, coverage-gap figures and combined totals throughout this piece come from an internal, reproducible analysis: authoritative best-track positions, the orbital mechanics of each satellite over the storm, and an independent public record of the acquisitions, held to a single scan-coverage definition applied identically to every satellite in view. Existing public satellites and Tomorrow.io’s are counted on the same terms, in the same window; where a public pass leads, the ledger records it.
Method · The RecordSame terms, both fleets
▽