The 2026 heat wave at its forecast U.S. peak, read as heat index — temperature and humidity together — from Tomorrow.io’s FOCUS model. Explore every lens as an interactive at info.tomorrow.io/heatdome.
Over the span of two weeks, a dome of hot, sinking air has settled over a hemisphere — Europe first, where the records have already fallen, and now the United States, where the heat is building toward a forecast peak over the Fourth of July weekend. A heat wave reaches the public as a single figure: a record high at a weather station. The figure is the least of it. This piece reads one event many ways — its peak, how long it holds, the nights that don’t cool, how rare it is — and follows it from a continent down to a single metro, and into the harvests, runways, and power grids in its path. Every number traces to a source.
It started in Europe
Europe went first, and it went in two waves. A surge in late May primed the ground and dried the soil; then a second, stronger wave arrived on June 17, just before the solstice, and did not relent. A surface already warm from the first wave had nothing left to buffer the second — so it climbed further, and faster.
By the last week of June, national records were falling across the continent. Spain reached 45.1°C at Andújar — its hottest June since records began in 1950. France reached 44.3°C at Pissos on June 23, the day its national heat index made it the country’s hottest since records began in 1947. And Germany set an all-time national record twice in days — 41.3°C at Saarbrücken on June 27, then 41.7°C at Neißemünde-Coschen on June 28 — past the 41.2°C mark from 2019. More than two dozen countries — 27 in all — ran far above their seasonal norms, in what World Weather Attribution called the most severe heat wave ever recorded over the region.
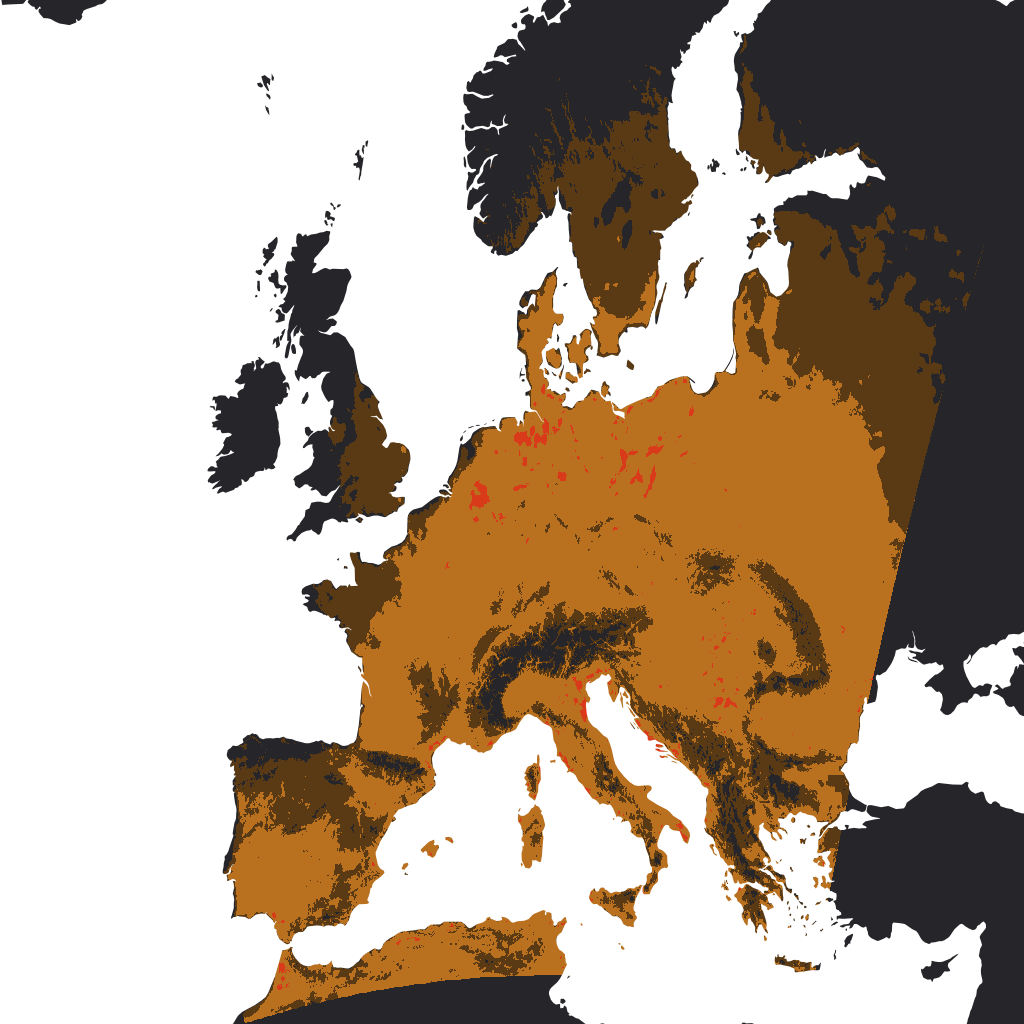
Read as heat index — the temperature folded together with humidity, the way the body actually feels it — Tomorrow.io’s FOCUS model put the European peak at a felt 117.6°F (≈47.5°C).
Europe measures heat this closely for a reason. In 2003, a comparable dome killed roughly 80,000 people across the continent — most of them not because of the temperatures alone, but because no system read the signal in time to move a public-health response before the mortality had already peaked. The heat-health infrastructure built since — the warning systems, the cooling centers, the hospital surge plans — is why 2026, by peak temperature the worst on record, was met with warnings issued days ahead. The record is what makes the news. The warning issued before it is what saves lives.
Then it crossed the Atlantic
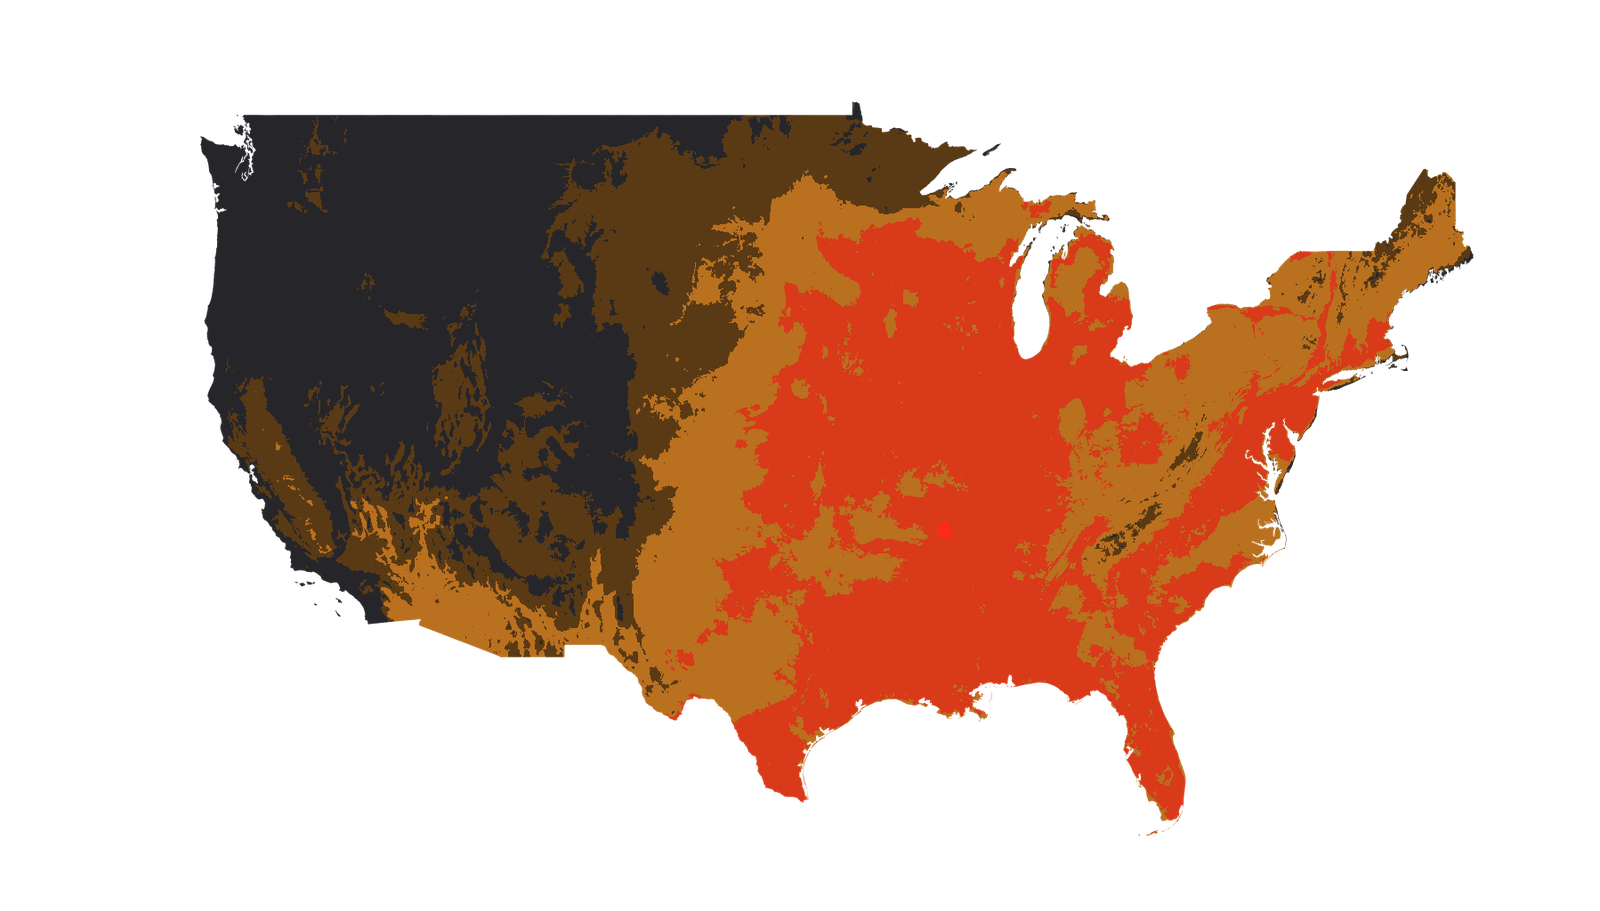
Days later, the same pattern is setting up over North America. The eastern two-thirds of the United States is falling under one contiguous dome — not a scatter of hot cities, but a single feature — and the sharpest heat is still ahead: the forecast carries the peak through the end of this week, into the Fourth of July weekend.
FOCUS puts the peak within the Lower 48 near 119°F felt. Heat in the Danger range — a heat index at or above 103°F, the National Weather Service threshold where heat illness becomes likely for most people — is forecast to cover roughly 2.5 million square kilometers, about a third of the Lower 48. The same physics as Iberia, a week later and an ocean away: a ridge of high pressure capping the air and baking the ground beneath it.
The episode is not finished. — Stéphanie Rist, French Health Minister, on the ongoing heat wave, June 2026
Why one number can’t hold it
A record high is a single reading, at a single hour, at a single station. The harm from a heat wave lives in the things that number leaves out: how long it lasts, whether the night lets the body recover, and how far outside normal it runs. Read the same FOCUS field four ways and the event stops being a temperature and becomes a shape.
Two of the four read the peak — a single worst reading: one on a fixed scale, one against the record. The other two read the duration — heat that is sustained and won’t quit: the days that pile up, and the nights that never let go. Each is a different hazard.
The peak · a single worst reading
The duration · sustained over the event
One field, four hazards — and no single number reads more than one of them. The afternoon high is the headline. The night that never cools is the hazard.
Scroll the full event from Europe to the U.S., switch between peak, duration, night floor, rarity, and records, and read the felt heat at your own location — all from the FOCUS field.
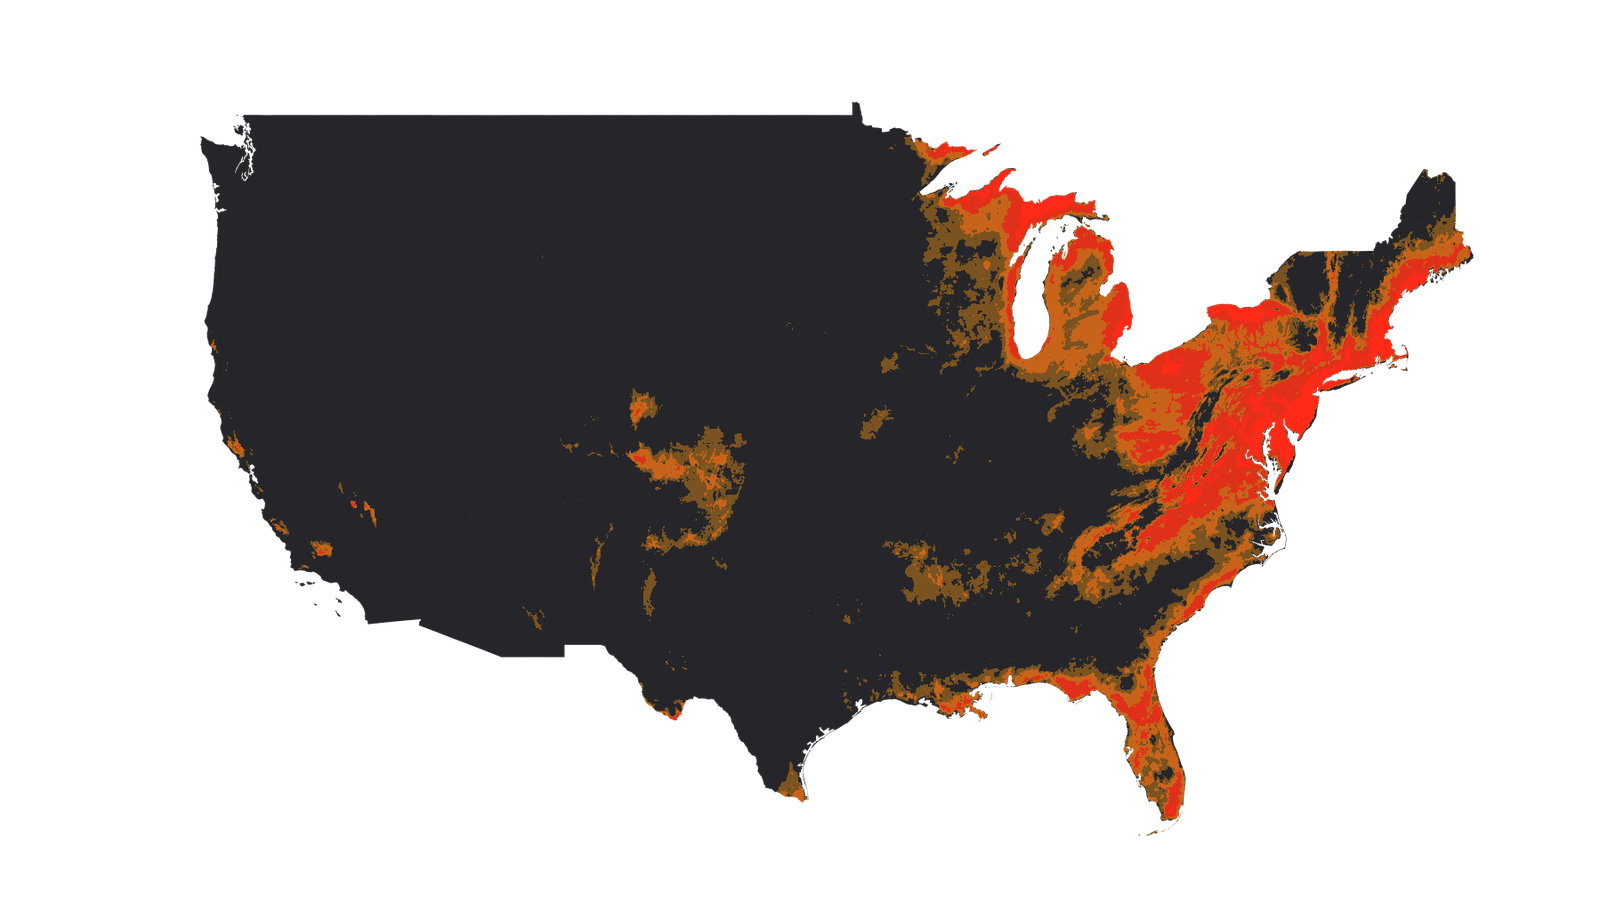
Where records are breaking
Hot is relative; record-breaking is measurable, and it is worth being precise about how much. Set the event’s forecast peak against a 30-year climate baseline for these same calendar dates, and the picture sharpens: nearly a quarter of the Lower 48 is reaching the top 1% of anything on file, and an eighth is crossing into outright record territory — the hottest that patch of ground will have been, for this week of the year, in the observational record.
How many people are at risk
Heat only matters where people are. Sample the FOCUS heat index at the center of the 50 largest U.S. metropolitan areas — some 184 million people — and sort each into a felt-heat band, and the event splits the country in two. At the forecast peak, about 69% of that population is in line for Danger-range heat, while the cooler Pacific metros stay under 90°F. The thin middle is the tell: this is not a gradient but a divide. Minneapolis, Memphis, Washington, and St. Louis are all forecast to peak near 110°F felt.
Heat stress is often called the “silent killer” — and European homes, workplaces and schools were not built for these temperatures. — Tedros Adhanom Ghebreyesus, WHO Director-General, June 28, 2026
What the heat costs
A dome overhead becomes a bill somewhere else. Read into the systems that were designed for a cooler normal, the same event shows up as stress on the harvest, the runway, and the grid — each in its own units.
The harvest. Across the Corn Belt, corn is still in its vegetative stage — about 42% of the way to silking, the crop’s heat-sensitive window still ahead. The dry-heat load is building: vapor-pressure deficit climbing from 1.2 to 1.8 kPa, with tens of stress-degree-days banked above the 29°C line where corn starts to suffer. Tomorrow.io’s Corn Crop Signal reads 176 bushels per acre against a 187 baseline — and logs it rather than calling it, because the edge is still below the model’s conviction bar. An honest model says “watching,” not “called,” until the evidence earns the call.
The skies. The intuition is that heat delays flights. Across 22 years of U.S. on-time data crossed with weather, severe-heat months do run 16.8% more weather-delay minutes than normal — but the driver is the convection that travels with heat, not the heat itself. Control for thunderstorms and the pure heat effect nearly vanishes; dry-heat cancellations actually fall about a fifth. Heat’s own signature is quieter and physical: density altitude. In Phoenix, thin hot air adds roughly 89 high-density-altitude hours a month — longer takeoff rolls, tighter payload limits — the penalty the heat imposes on its own, once the storms are set aside.
The grid. Heat squeezes power from three sides at once. Air-conditioning demand spikes where it feels 95°F or hotter — about 37% of the Lower 48. Transmission lines carry less as the air heats: a conductor rated at 25°C can shed roughly a tenth of its capacity by 40°C. And more than half the country — 54% — faces nights too warm for an overnight reset, when demand never troughs and equipment never cools. Europe showed the same physics at the extreme: three French nuclear plants — Nogent, Bugey, and Golfech — cut output as the rivers they use for cooling crossed their regulatory temperature limits, trimming 4.1 GW, about 7% of national supply, on June 25.
Supply falls exactly as demand refuses to.
Measured from orbit
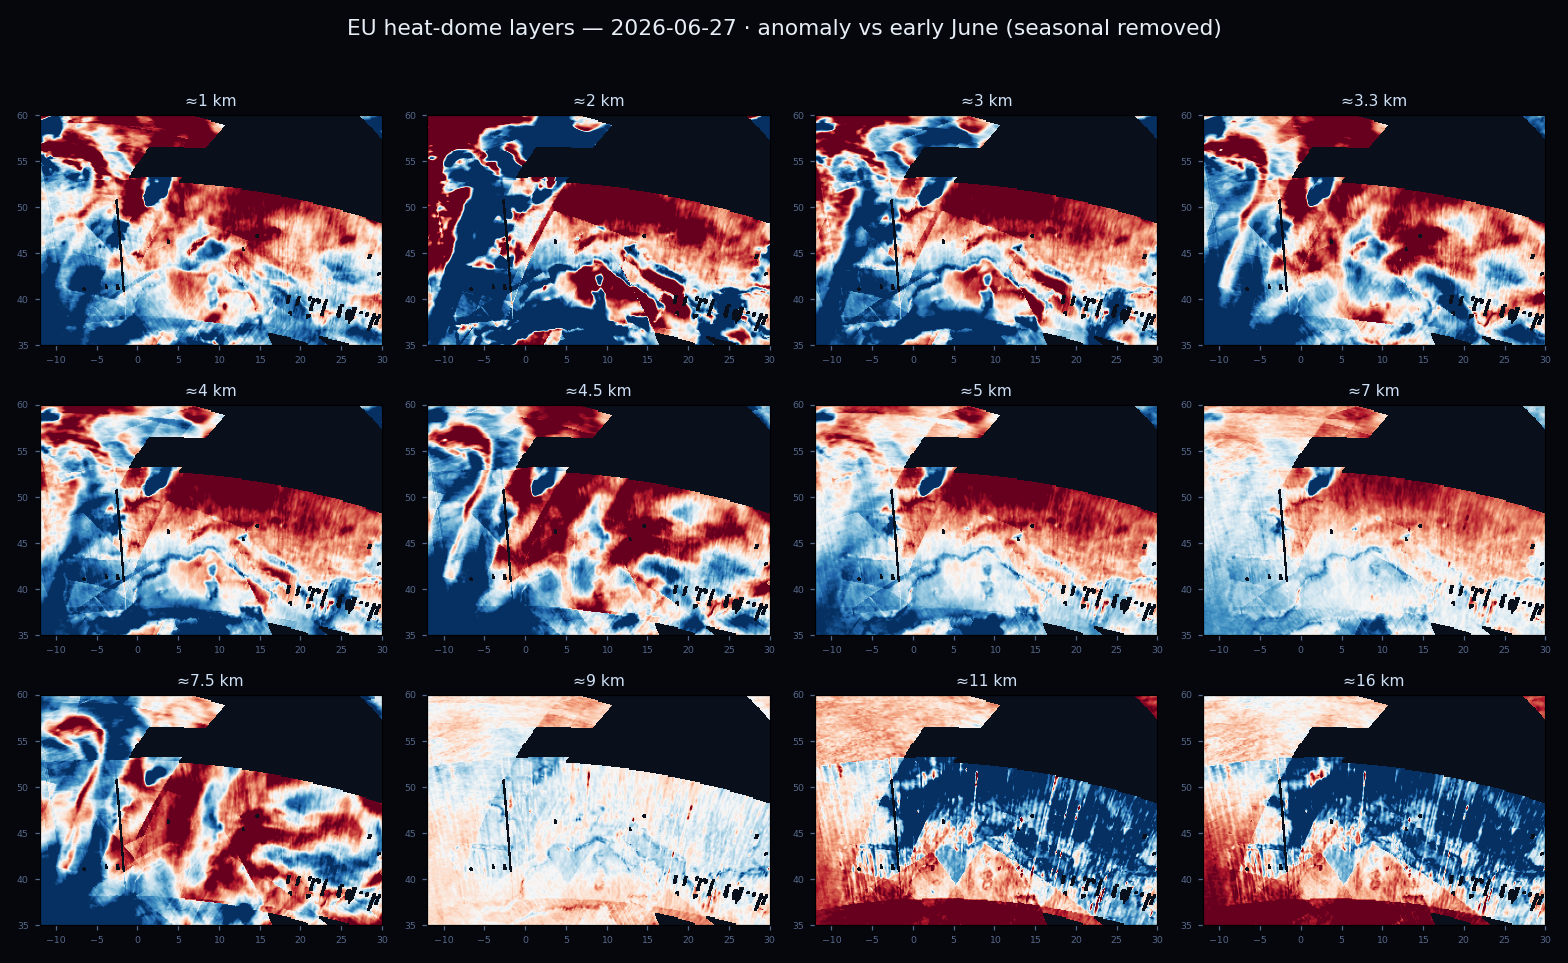
One more read, and this one is not a model — it is a measurement. Tomorrow.io’s own microwave sounders resolved the European dome’s vertical structure from space: a warm anomaly of about +7.7° near 2 km, flipping to roughly −6° in the upper troposphere. That inversion — warm below, cold aloft — is the heat dome’s fingerprint: a lid of sinking, high-pressure air trapping the heat against the ground. The map you feel at street level and the physics ten kilometers overhead are the same object, seen from two ends.
What the data doesn’t say
The honest version of this piece names its own limits, because the reading is only as good as its caveats.
The forward-looking days are read from FOCUS across models and labeled as such. The share-of-population figure is felt-heat exposure — heat index against metro population — not a health index; the National Weather Service’s HeatRisk folds in duration and local medical data and would read differently. The grid-stress figures are modeled exposure from the temperature field, not metered load. The crop model logs a below-baseline read but does not call it. And the aviation delay is mostly convection, not heat.
Two larger cautions sit above all of these. Whether a warming climate made this event more likely is the domain of formal attribution work, which this piece cites rather than re-derives.
This heat would have been virtually impossible without human-caused climate change — and it is roughly 200 times more likely today than it was 20 years ago. — World Weather Attribution, rapid analysis of the 2026 European heat wave, June 2026
And the measure that matters most, the human toll, takes weeks of excess-mortality analysis to establish; Europe’s confirmed count was already past 1,300 (WHO) and rising as this was written, and the true figure will arrive later and be larger. A number you can check later is worth more than a number that sounds certain now.
One event, one instrument
Read back over everything above. The European dome and the American one. The peak, the duration, the night floor, the rarity. The harvest, the runway, the grid. The vertical structure from orbit. Every one of those reads came from the same place — one continuous model of the atmosphere, Tomorrow.io’s FOCUS, fine enough to follow a single event from a continent down to a city block.
That is what a weather model is for. Not one number for the newscast, but a field dense enough to answer every different question a heat wave raises — how long, how rare, how many people, whose harvest, which runway, what grid — and honest enough to mark the questions it can’t yet answer. The 2003 heat wave was deadly in part because the signal was there and the instruments to read it, at scale and in time, were not. Every heat wave since has been a little more legible than the last, because the observation got a little denser.
Tomorrow.io’s mission is to make that completeness ordinary: to build and proliferate the observation — from orbit and from the ground — that turns a hazard from a surprise measured at one station into a field that can be read everywhere, in advance, by the institutions whose job is to act on it. The 2026 heat wave is one event. The way it can now be read is the point. The temperature is never the story. The field is.
Sources & method
- Records & reporting. Station records from the national meteorological services — AEMET (Spain, 45.1°C at Andújar, hottest June since 1950), Météo-France (France, 44.3°C at Pissos, hottest day since 1947; the all-time 46.0°C stands from 2019) and the Deutscher Wetterdienst (Germany’s all-time 41.7°C at Neißemünde-Coschen, provisional). European mortality and health guidance from the World Health Organization (1,300+ heat-linked excess deaths since June 21, still rising; ~70,000–80,000 in 2003 for comparison). Attribution from World Weather Attribution (June 2026). French grid reductions from RTE/EDF (~4.1 GW trimmed on river cooling-water limits, June 25). “Feels-like” is the U.S. National Weather Service heat index (Danger from 103°F). Human quotes as attributed in the text.
- Analysis. Every felt-heat, duration, overnight, rarity and impact figure — the 117.6°F and 118.9°F peaks, the record and top-1% shares (against a 30-year climate baseline), the exposure split across the 50 largest U.S. metros (~184 million people), and the farm, aviation and grid reads — is Tomorrow.io Weather Intelligence analysis, produced on our own systems: the FOCUS atmospheric model, the Corn Crop Signal, and our microwave sounders. Figures dated July 1 reflect the forecast peak as of publication.
- Explore. “The 2026 Heat Wave” — the full scrollable event and every lens in this piece, at info.tomorrow.io/heatdome.
▽